TikTok Ban, Meta Thrives: Zuckerberg's AI Ambitions Skyrocket!
 05/06 2025
 875
875
Recently, advertising companies have faced growth pressures due to waning local consumption and tariff impacts. The earnings reports from Google and Snapchat, coupled with their varying macroeconomic outlooks (Google's optimism contrasting with Snapchat's cautiousness), have further muddled market expectations. Consequently, as the world's second-largest advertising platform, Meta's guidance for Q2 growth will be pivotal for the entire industry's outlook and subsequent stock price movements of related firms.
Moreover, in this rapidly changing environment, whether Meta adjusts its Capex and Opex targets will significantly influence the profit margins of its shareholders and the industrial investments of companies within the AI industry chain.
Let's delve into the details:
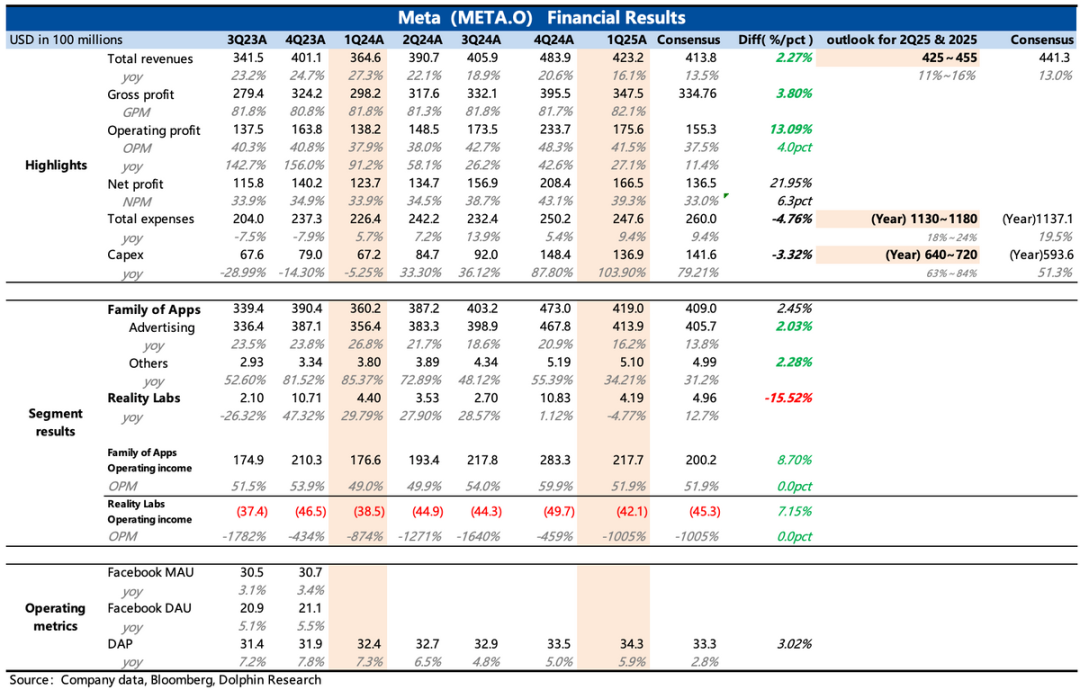
1. Solid Guidance Amidst Manageable Tariff Impact: Meta's Q2 revenue guidance ranges from $42.5-$45.5 billion, indicating growth of 11%-16%, with a 1-percentage-point boost from currency exchange rates. Market expectations are mixed, spanning from conservative single-digit to optimistic low double-digit growth. However, Meta's guidance generally aligns with these expectations.
Collectively, the outlooks from Google, Snap, and Meta confirm that during industry downturns, large-traffic performance advertising leaders exhibit greater resilience by absorbing brand advertising budgets from smaller platforms.
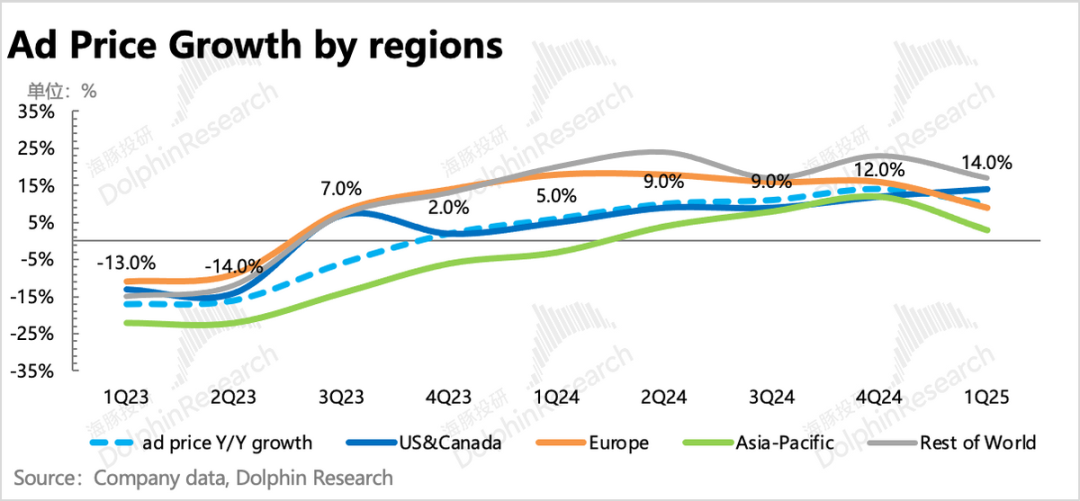
2. Q1 Benefit from TikTok Ban: Analyzing ad revenue drivers—impression volume and average price growth—I focus on marginal changes in growth rates. While impression volume adjustments are relatively straightforward for leading platforms, average ad price growth is closely tied to macroeconomic conditions and competition.
In Q1, average ad prices grew by 10%, a natural slowdown from the previous quarter. However, in North America alone, average price growth accelerated to 14% (from 12% in Q4 2024). Given the current economic data, this suggests that Meta's competitive advantage was amplified in Q1, likely due to the TikTok ban.
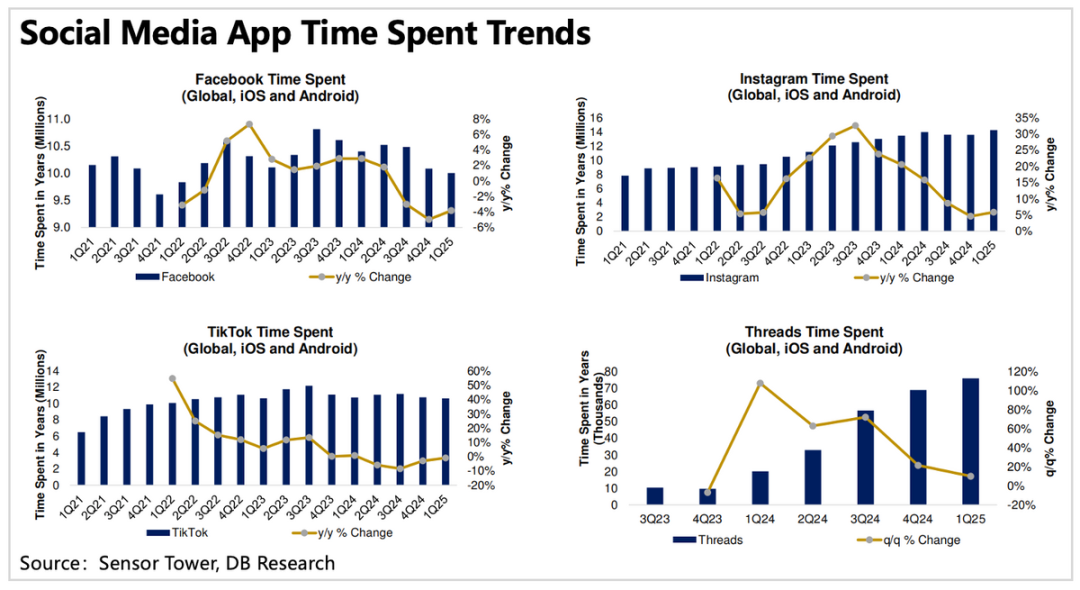
Sensor Tower data reveals that Meta's FB, IG, and the new platform Threads all experienced traffic growth around the TikTok ban in January. Notably, even Facebook, considered an aging platform, saw a net increase of 750,000 daily active users, reflecting users' need for alternatives.
Advertisers similarly shifted their budgets from TikTok to Meta's platforms, indicating that Meta's revenue exceeded expectations partly due to TikTok's issues. Conversely, as the TikTok ban continues, some advertisers may temporarily redirect their budgets back.
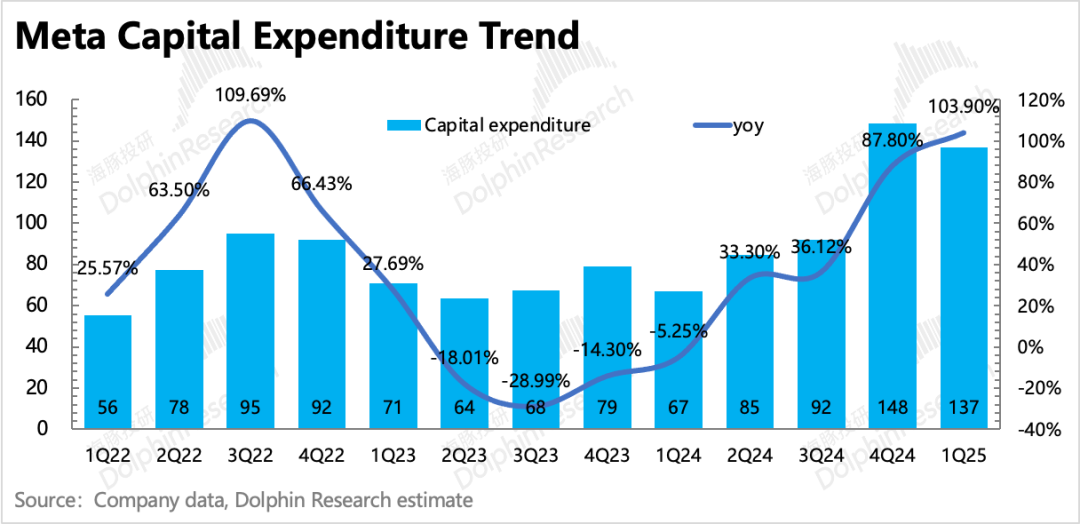
3. AI Focus and Increased Capex: The market closely monitors Capex guidance from major model/cloud platform giants, reflecting upstream industry chain growth expectations and validating AI demand.
Meta has increased its full-year Capex range to $64-$72 billion, up from the previous $60-$65 billion. The market has largely responded positively to these giants' high Capex, recognizing that relying solely on organic growth amid current complexities carries significant risks. Persisting in AI investments suggests a robust end-user demand.
Since April, Meta has launched LIama 4 and Meta AI, an independent AI app embedding Llama 4. Despite Llama 4's rushed launch encountering issues, Meta AI leverages years of social data to create a more intelligent AI agent, achieving competitive differentiation.
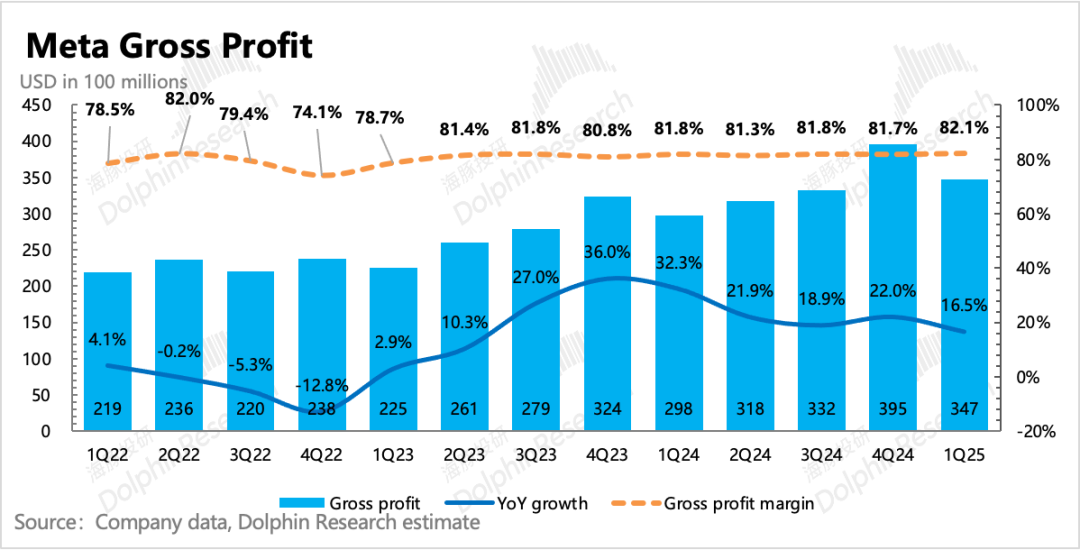
4. Lower Opex, Efficiency Year 2.0: Due to extended server depreciation in Q1, gross margins improved year-over-year and quarter-over-quarter. Despite increased R&D expenses, total operating expenses (excluding legal fees) grew at a slower rate of 9.4% compared to revenue growth, enhancing short-term profitability.
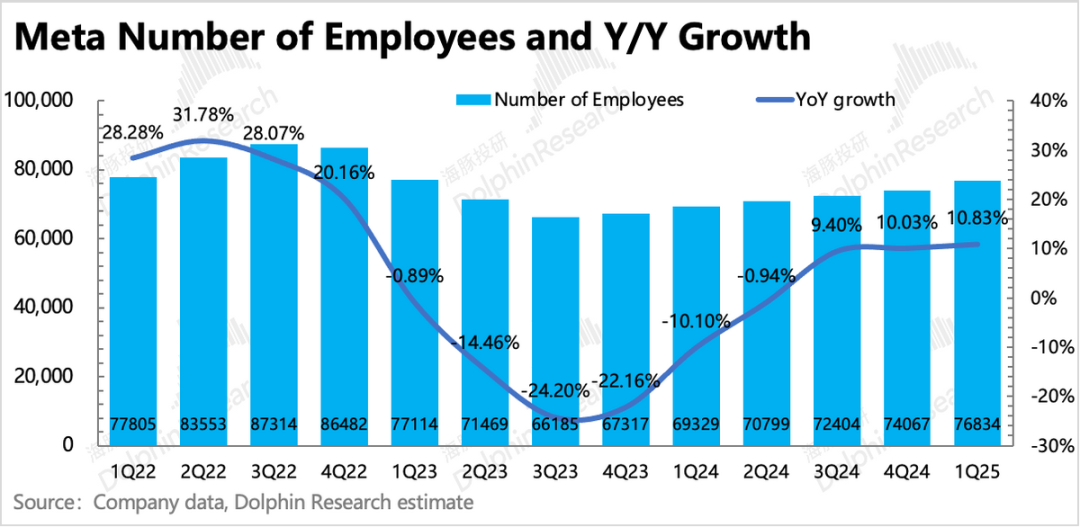
Meta lowered its full-year Opex guidance by $1 billion, now ranging from $113-$118 billion. Despite a nearly 2,800 increase in employee headcount in Q1 and ongoing 5% layoffs announced in January, Zuckerberg has mentioned AI's potential to replace internal R&D engineers. Thus, to navigate complexities and alleviate profit growth pressure (expecting single-digit growth or flat growth), Meta may initiate another efficiency year strategy, optimizing non-core AI R&D teams.
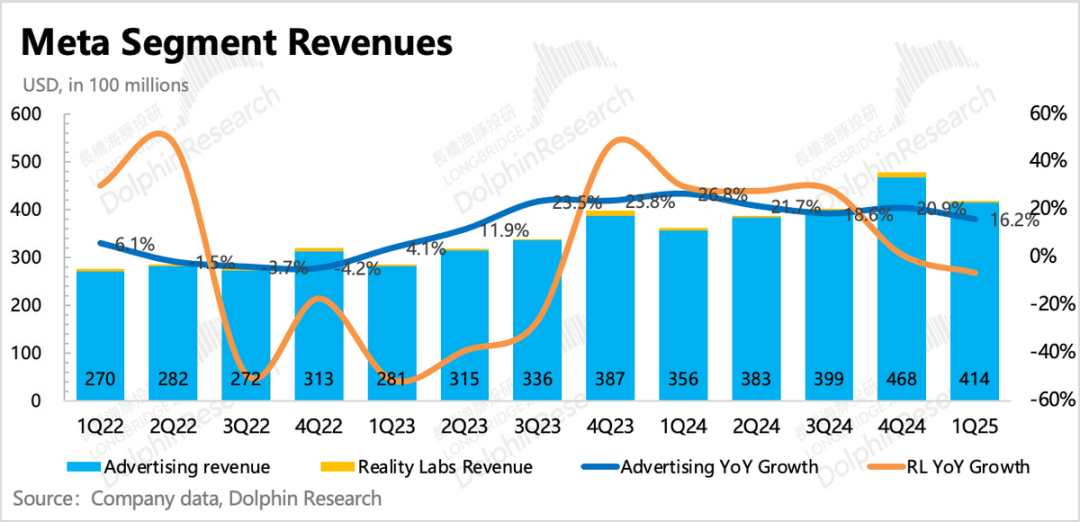
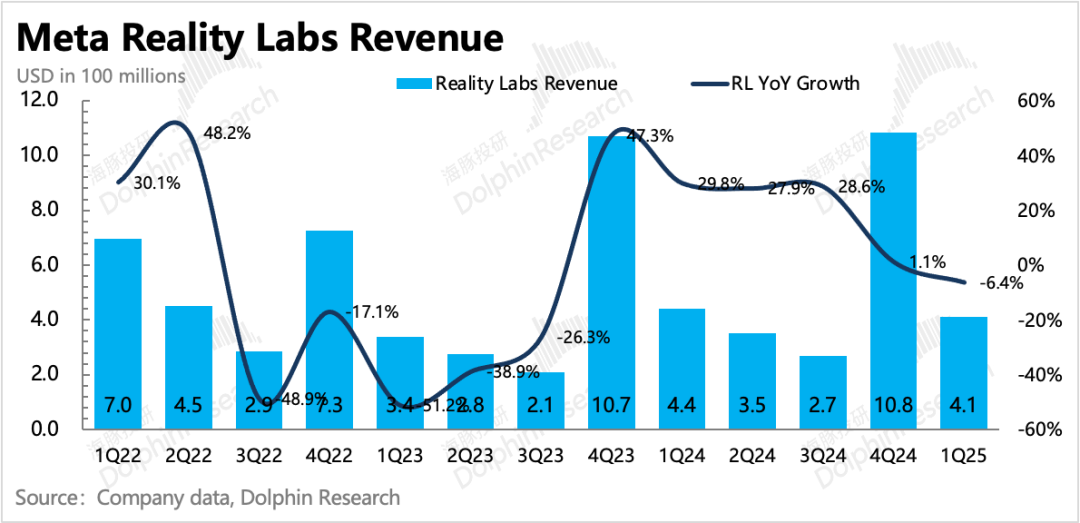
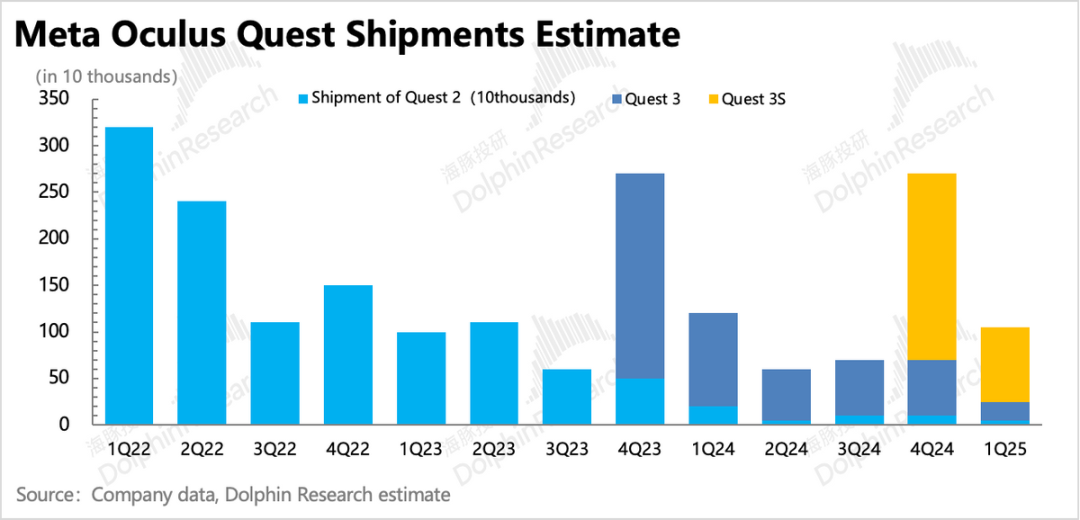
5. VR Sales Slowdown Post-Holiday: Reality Labs' VR business reflects the market demand slowdown post-holiday sales. Q1 revenue was $412 million, down 6% year-over-year, indicating that Quest 3S's holiday season performance did not carry over.
RL's operating loss widened in Q1, and recent rumors suggest Meta intends to further optimize the RL lab. Achieving sustained profitability in the short to medium term seems unlikely. As Meta continues optimizing teams and reducing investments, a turnaround may accelerate.
6. Cash Utilization and Shareholder Returns: At Q1's end, Meta had $70.2 billion in cash and short-term investments, with a net cash position of $41.4 billion after deducting long-term debt, down $7.5 billion from the previous quarter. The company generated $10.3 billion in free cash flow, paid $1.33 billion in dividends, and spent $12.8 billion on repurchases. Annualized, 2025 shareholder returns (repurchases of $53 billion + dividends of $5.5 billion) are expected to yield a total return of nearly 4%, higher than the previous quarter due to declining market capitalization.
7. Performance Indicators Summary
Dolphin Insights
Prior to Google's earnings report, the market was unclear about tariff impacts on advertising. However, it was evident that tariffs would affect the industry more than leading companies with substantial traffic and effective advertising. Thus, growth expectations for Google and Meta were tentatively lowered by 2%-3%, primarily to drive down valuations. Historically, Meta's valuation dropped to 17x and Google's to 15x during Trump's heaviest tariffs.
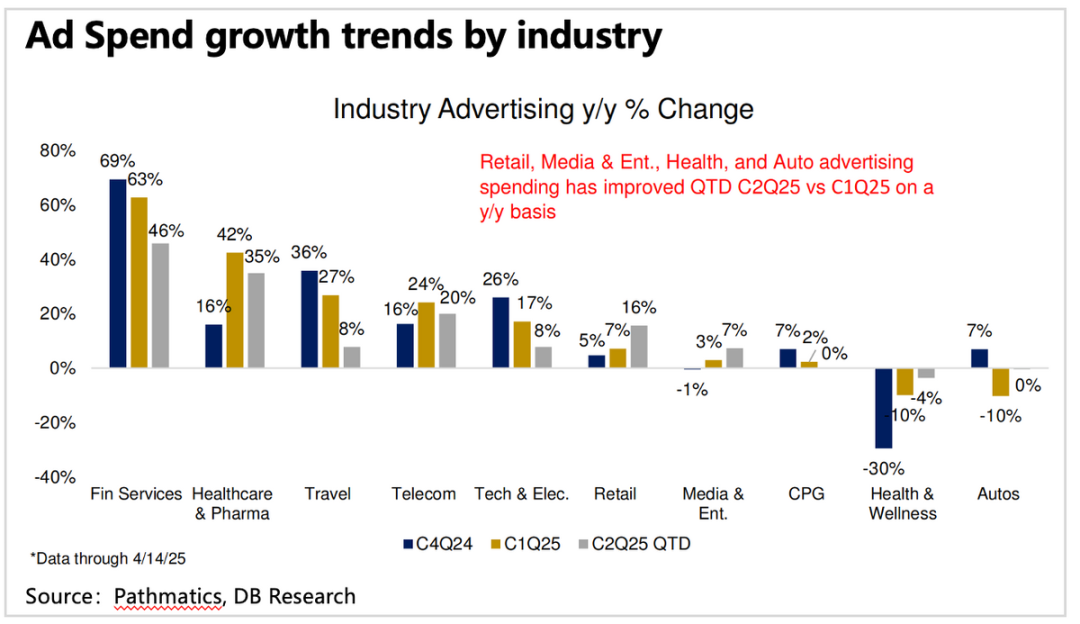
In Q1, both performed well, but their growth drivers differed. Google benefited from significant growth in finance, pharmaceuticals, and tourism—advantageous areas for search advertising. Meta's growth partly benefited from the TikTok ban.
Given the ongoing tariff war (despite recent easing), Trump's daily reversals, and determination to address government debt suggest future tariff changes, especially with positive market sentiment. Advertisers are likely to adjust spending intentions this year due to uncertainty. Thus, Meta's Q2 revenue guidance may only provide temporary relief.
As we enter May, with adjustments to the tax-free policy for small parcels, Meta may face additional impacts from the retreat of Chinese advertisers. In 2024, Chinese advertisers accounted for 10% of revenue, with physical e-commerce trade being the largest contributor and directly affected by high tariffs.
Take Temu as an example. In early April, Temu suspended almost all US marketing activities. Market estimates suggest that if the suspension continues and local merchants fill the gap, the impact will be about 2% of 2025 total revenue (currently where market expectations have been lowered); otherwise, the impact could be greater.
Finding new growth engines while improving operational efficiency will alleviate profit release pressure this year. The market positively responds to giants maintaining/increasing Capex, demonstrating confidence in end-user AI demand.
However, profits will remain under pressure this year. With a current market capitalization of $1.39 trillion, Meta trades at a 25-year P/E ratio of 22x (assuming 13% revenue growth and total expenses of $113 billion, implying 5% profit growth), similar to the historical average. Pessimistic and optimistic valuation scenarios are 16x and 28x, respectively. Given advertising impacts often lag the economy by a quarter, growth expectations in the second half may still face volatility, affecting valuation rebounds.
Recent market sentiment and valuations have improved alongside tariff easing. Thus, for investors seeking a higher safety margin, it may be prudent to wait for more pessimistic market sentiment.
In the medium to long term, I'm optimistic about Meta, which possesses high social barriers. Facing AI-driven traffic reshuffling, Meta can rely on its moat to resist risks while leveraging leading AI models to enhance user experience through product applications and services.
Detailed Analysis Below
I. Advertising: Benefiting from Competitive Advantages, Slightly Positive Guidance
In Q1, Meta's revenue was $42.3 billion, up 16% year-over-year, exceeding guidance and adjusted market expectations. The primary driver was the advertising business, accounting for 98% of total revenue. The VR business experienced a slower-than-expected off-season slowdown, and the shopping boom did not extend into Q1, resulting in lower-than-expected revenue.
Q1 performance didn't reflect the tariff war's impact, but Meta's Q2 revenue guidance is solid:
Meta expects total Q2 revenue to range from $42.5-$45.5 billion, up 11%-16% year-over-year, with a 1-percentage-point boost from currency exchange rates. While market expectations (BBG) fall within the guidance range, institutions tend to be cautious, making Meta's guidance slightly above expectations.
Breaking Down by Business:
1. Advertising Business: Accelerating Average Price Growth Highlights Competitive Advantage
For the advertising business, analyzing volume and price growth trends offers insights into the macro environment and competition.
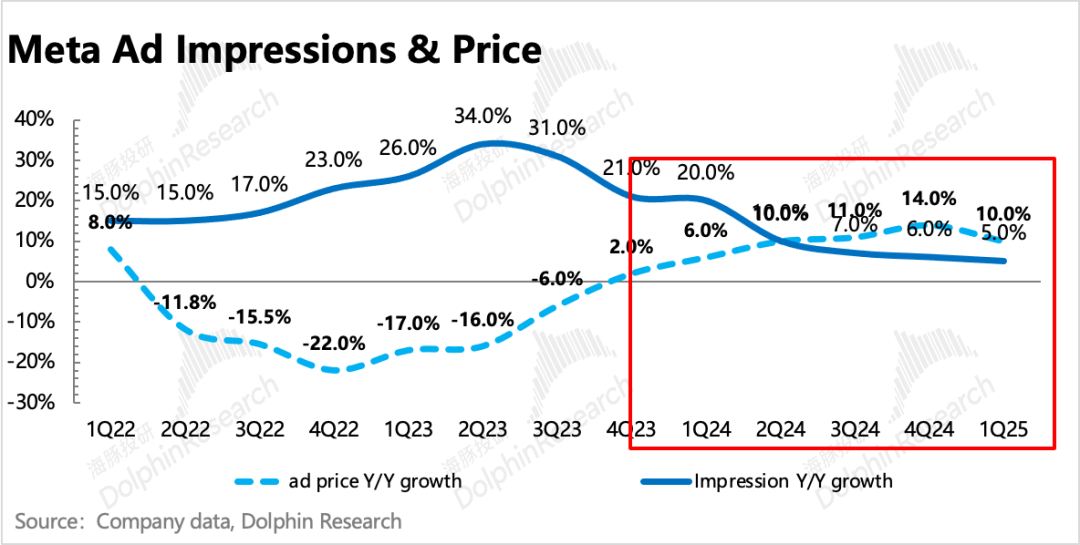
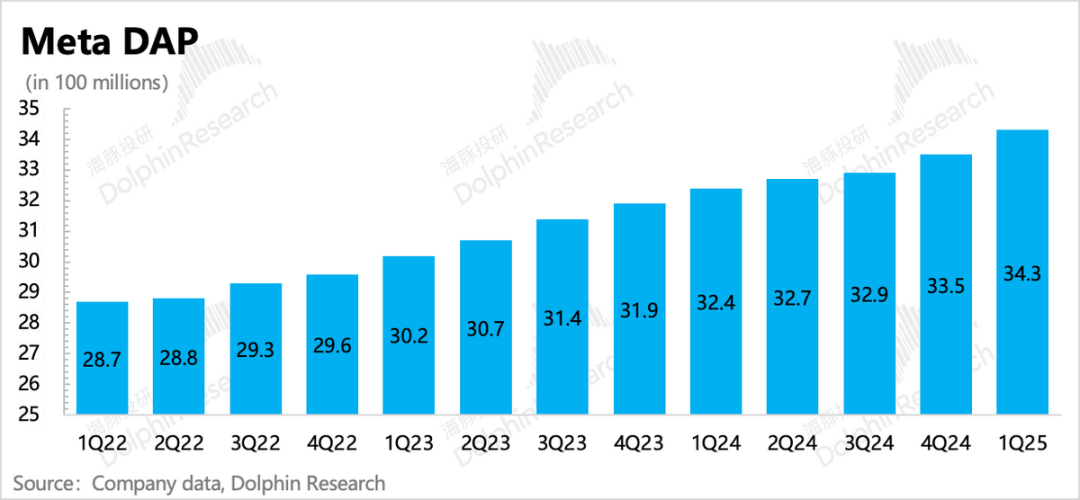
(1) In Q1, ad impression growth continued to slow to 5%, but the user base expanded (total daily active users (DAP) increased 6% year-over-year). This suggests that the average number of impressions per user declined by 0.8% year-over-year. While partly due to active adjustments, it's also possible that current platforms' high ad load rates indirectly affect user experience (e.g., users reporting 7-8 ads per day on Reels).
(2) Since Q1 2024, Meta stopped disclosing Facebook and ecosystem monthly active users (MAU). Thus, I mainly refer to third-party user engagement data (Sensor Tower) for analysis:
In Q1, average ad prices grew by 10%, a natural slowdown from the previous quarter. However, in North America alone, average price growth accelerated to 14% (from 12% in Q4 2024). Given recent economic data, this suggests Meta's competitive advantage was amplified in Q1.
Sensor Tower data shows that Meta's FB, IG, and Threads experienced traffic growth around the TikTok ban in January. Notably, even Facebook saw a net increase of 750,000 daily active users, reflecting users' demand for alternatives.
The chart below shows that user engagement growth rates on Meta's apps have bottomed out and started recovering.
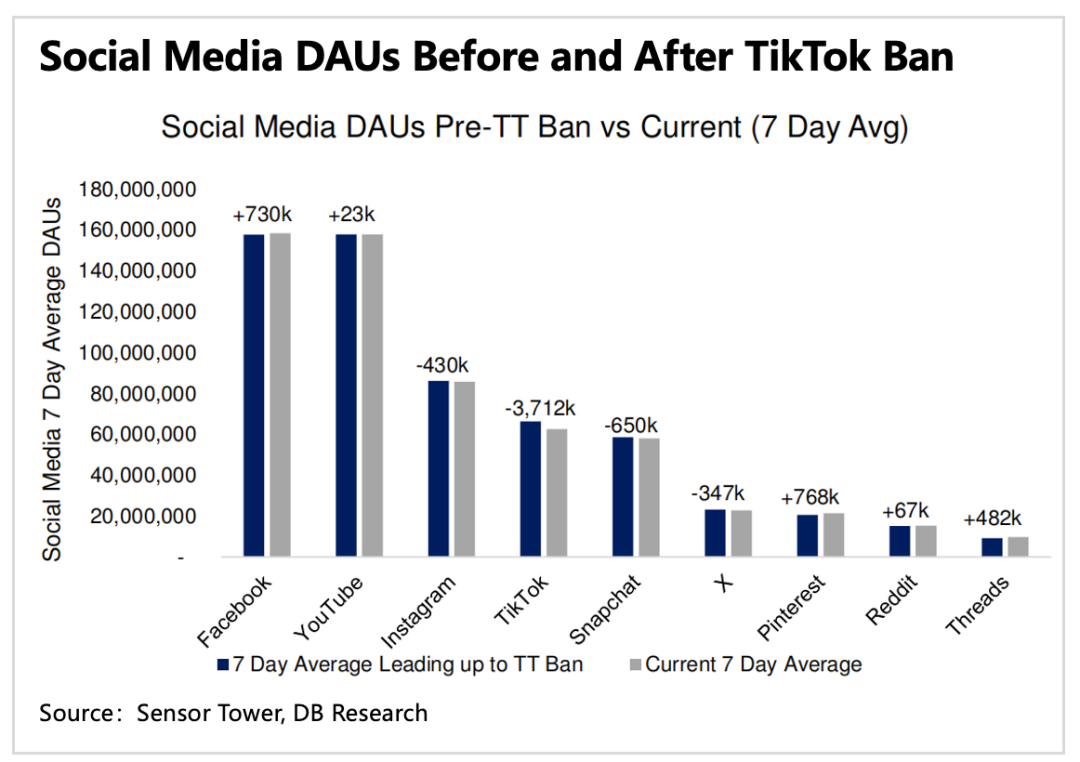
Advertisers similarly shifted budgets from TikTok to Meta's platforms, illustrating that part of Meta's over-expected revenue benefited from TikTok. However, as the TikTok ban continues, some advertisers' short-term budgets may also return to some extent.
2. VR: Peaking and Falling, Even Lighter in the Off-Season
Regarding the VR business, there is limited room for discussion, primarily mirroring the market's lull in demand following the robust sales of Quest 3S during the shopping season. First-quarter revenue amounted to $412 million, marking a 6% year-on-year decline, as the strong holiday season performance of Quest 3S did not carry over into the first quarter.
The RL business experienced an increase in operating losses during the first quarter, and recent rumors suggest that Meta aims to continue optimizing the RL lab. Given the current trajectory, achieving sustained and stable profitability in the short to medium term appears challenging. Until the VR content ecosystem matures, accelerating the turnaround from losses may hinge on the continuous optimization of relevant teams and a reduction in investments.
II. Will Efficiency Year 2.0 Be Launched Amidst Growth Uncertainty?
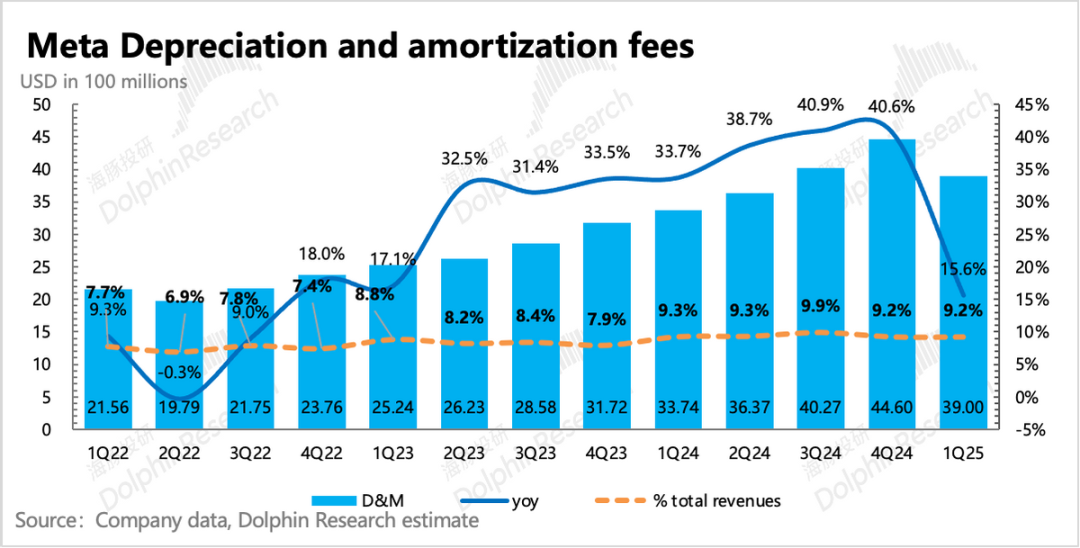
Due to the extension of server depreciation in Q1, the gross margin improved both year-on-year and quarter-on-quarter. Despite an increase in R&D investment, the overall total operating expenses, excluding legal fees, grew at a year-on-year rate of only 9.4%, less than the revenue growth rate, thereby enhancing short-term profitability.
Management also revised downward the full-year operating expense guidance, reducing it by $1 billion to a range of $113 billion to $118 billion. Although the company net-hired nearly 2,800 employees in Q1, the 5% layoffs announced in January might still be ongoing, insufficient to offset the influx of new R&D personnel. Zuckerberg has repeatedly emphasized the future trend of AI replacing internal R&D engineers.
Therefore, to navigate the complex environment and alleviate the pressure on profit growth this year (expected to grow by a single-digit percentage or remain flat), Dolphin speculates that Meta may once again implement the Efficiency Year strategy, optimizing teams beyond those focused on core AI research and development.
Capital expenditure in the first quarter reached $13.7 billion, and Meta increased the full-year capital expenditure guidance to a range of $64 billion to $72 billion, a notable increase from the previously anticipated range of $60 billion to $65 billion. Maintaining or increasing capital expenditure aligns with the expectations of most market institutions.
The market generally responds positively to these giants' high capital expenditure: in the current complex environment, relying solely on organic growth entails greater risks. Their commitment to increasing AI investment underscores their recognition of robust end demand.
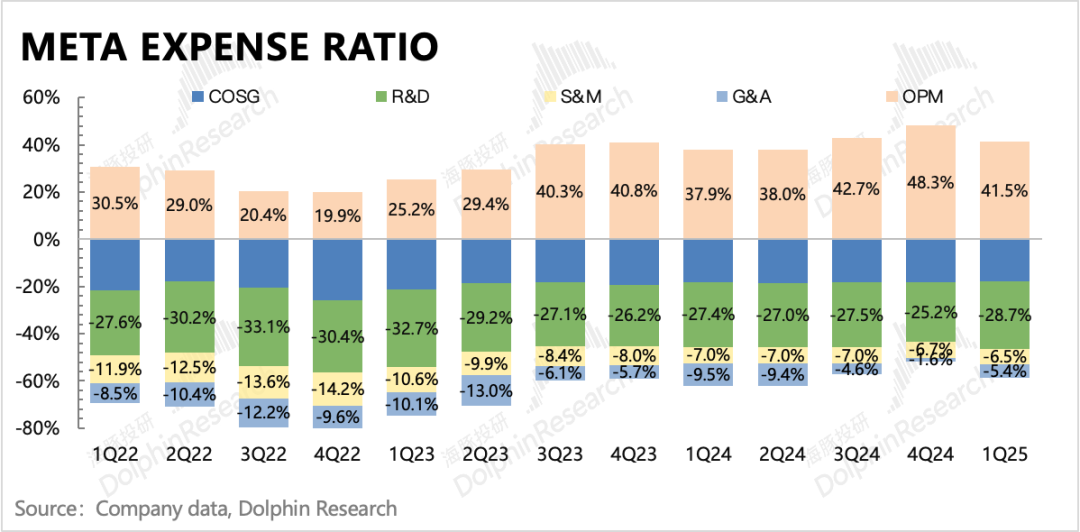
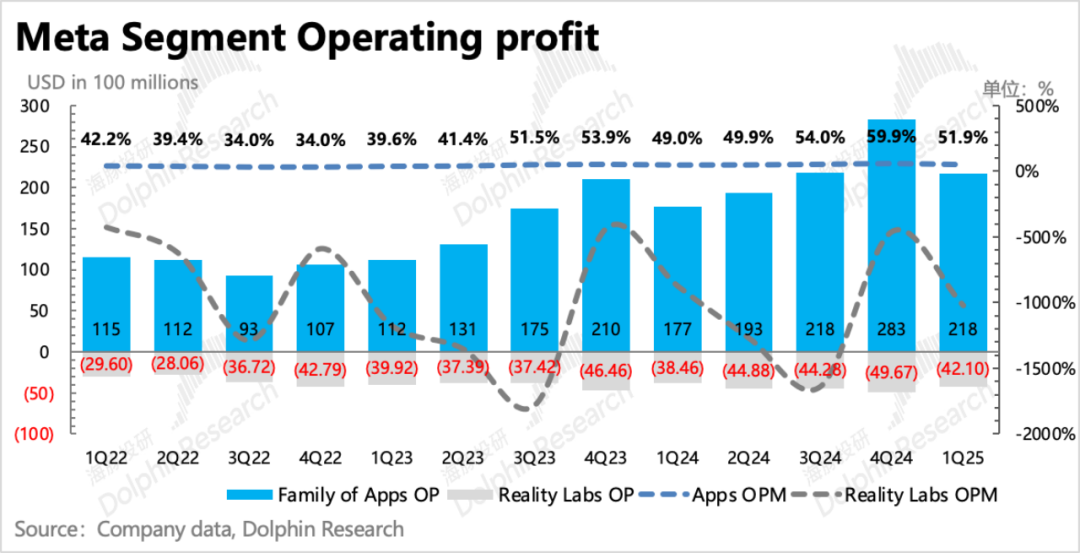
As in the previous quarter, the operating profit margin fell to 41.5% in Q1 but remained above the level from the same period last year. The 5% layoff announced earlier this year and the extension of server depreciation lives contributed to this performance.
The 5% workforce optimization likely targeted traditional advertising departments, operation management departments, and basic code developers. Zuckerberg recently stated that AI is expected to replace nearly half of basic engineers. However, concurrent recruitment of AI-related technology developers might not fully reflect the layoff's impact on overall employee costs. Even the significantly higher salaries of AI talent could still have a considerable pull on employee expenses.
Extending the depreciation life, as mentioned by Dolphin in the previous quarter's review, was also expected. Notably, compared to peers like Microsoft and Google in the Mag 7, Meta had not extended its server depreciation life since 2022. The company announced last quarter that, starting this year, the average depreciation life of Meta's overall servers would be extended from 5 years to 5.5 years (with a depreciation life of 6 years). This adjustment is anticipated to save $2.9 billion in operating expenses this year.
The incremental expenses are mainly reflected in R&D expenditures, with a year-on-year growth rate of 21.8%, while other expenses require continued strict control: administrative expenses in the first quarter declined by 34% year-on-year, primarily due to a high base resulting from a legal fee provision last year, and the growth rate of sales expenses slightly rebounded to 7.5%.

Ultimately, Meta's operating profit margin for the first quarter stood at 41.5%. Breaking down the advertising and VR businesses, the increase in profit margin was primarily driven by the advertising segment. As anticipated by company management, VR losses continued to widen year-on-year, and significant loss reduction necessitates more best-selling products.
However, in the short term, VR lacks sufficient content ecosystems and catalysts, and promoting hardware relies heavily on cost-effectiveness. Perhaps a shift in perspective, with new hardware categories like AI glasses or the combination of XR+AI, could emerge as new growth drivers.
- END -
// Reprint Authorization
This article is an original by Dolphin Investment Research. For reprinting, please obtain whitelisting authorization.
// Disclaimer and General Disclosure Notice
This report is intended for general comprehensive data use and is designed for general browsing and data reference by users of Dolphin Investment Research and its affiliated institutions. It does not consider the specific investment objectives, investment product preferences, risk tolerance, financial situation, or special needs of any individual receiving this report. Investors must consult independent professional advisors before making investment decisions based on this report. Any individual who makes investment decisions using or referencing the content or information in this report assumes all associated risks. Dolphin Investment Research shall not be liable for any direct or indirect liabilities or losses arising from the use of the data in this report. The information and data in this report are based on publicly available sources and are for reference only. Dolphin Investment Research strives to ensure but does not guarantee the reliability, accuracy, and completeness of the relevant information and data.
The information or opinions expressed in this report may not be construed as an offer to sell securities or an invitation to buy or sell securities in any jurisdiction, nor do they constitute advice, inquiries, recommendations, etc., regarding the relevant securities or related financial instruments. The information, tools, and data in this report are not intended for distribution to citizens or residents of jurisdictions where the distribution, publication, provision, or use of such information, tools, and data would violate applicable laws or regulations or subject Dolphin Investment Research and/or its subsidiaries or affiliated companies to any registration or licensing requirements of such jurisdictions.
This report solely reflects the personal views, opinions, and analysis methods of the relevant authors and does not represent the position of Dolphin Investment Research and/or its affiliated institutions.
This report is produced by Dolphin Investment Research, and its copyright is solely owned by Dolphin Investment Research. Without the prior written consent of Dolphin Investment Research, no institution or individual may (i) produce, copy, replicate, reproduce, forward, or make any form of copies or reproductions in any manner, and/or (ii) directly or indirectly redistribute or transfer them to other unauthorized persons. Dolphin Investment Research reserves all relevant rights.
-
![]()
Model Giant Jieyue Xingchen Steps into Smartphone Arena: A Strategic Alliance with Huaqin Technology
-
![]()
Big Model Firm Dives into Phone Market: StepFun and Wingtech Forge a ‘Dynamic Duo’
-
![]()
Zhongrun Optics Makes a Bold Move with 1 Billion Yuan Investment: Is a Turning Point on the Horizon for the Precision Optics Industry?
-
![]()
Deploy CLBO Crystals and YIG Single Crystals! Erythritol Leader Invests 30 Million in Youwei Optoelectronics
-
CXMT’s July 16 Subscription: Leading Domestic Memory Manufacturer—What’s the Earning Potential per Lot?
-
![]()
Rhythm Discrepancy and Premium Value Erosion: Foreign Luxury Brands Must Re-evaluate Their China Strategy
-
![]()
Half-Year, 1 Billion Yuan Financing, 7 Billion Yuan Valuation: A New Dark Horse Emerges in the Embodied AI Sector
-
![]()
Strong Rebound for Tech Stocks in Hong Kong Stock Market: Is It Time to Bottom-Fish?