The DeepSeek Moment for Autonomous Driving Algorithms: Alibaba's Open-Source Qwen-Drive?
 09/10 2026
 510
510
Recently, the Alibaba Qwen team and Huazhong University of Science and Technology released a technical report (arXiv ID: 2609.00111) titled Qwen-Drive-1.0. On the same day, it was simultaneously launched on HuggingFace, ModelScope, and GitHub under the Apache 2.0 license, allowing unrestricted commercial use without legal barriers.
The model has a total of 5B (five billion) parameters and can run on a graphics card with 24 GB of VRAM. The GitHub repository includes inference code, scenario files for four test sets, and a ready-to-use demo dataset. However, the training code is not provided.
This marks the first open-source intelligent driving model from a Chinese tech company that supports free commercial use, following our previous article on Nvidia Alpamayo, which only supports research and not commercial use.
This article aims to clarify four key aspects: Qwen-Drive's software architecture, the functions of each module, how the system was trained, and what a typical company can achieve with it. Finally, we will discuss the implications for autonomous driving and Physical AI.
We hope to provide insights and information for the automotive autonomous driving industry and Physical AI.
The Problems It Aims to Solve
In academia, a popular approach for VLA (Vision-Language-Action) intelligent driving algorithms in the past two years has been to use a general brain and train it with large amounts of "image-based driving question-answering" data. For example, publicly available datasets like DriveLM, DriveGPT4, OmniDrive, and NuInstruct follow this method, framing perception, prediction, and planning as question-answering pairs, enabling the model to learn driving tasks through a unified language interface.
However, Qwen-Drive-1.0 identifies two critical flaws in this approach.
First, text cannot accurately represent 3D space. While a model can be trained to describe scenes eloquently, text-based objectives never require it to state precise distances like "that car is 12.4 meters away," making it impossible to verify spatial accuracy. The paper puts it bluntly: A model trained solely on question-answering can generate fluent scene descriptions but may be inaccurate in 3D space.
To draw an analogy, this is like passing the written driving test (Theory Test) but still being unable to park without hitting something.
Second, new knowledge overrides old knowledge. Training a general brain with massive driving data can turn it into a "specialist that only sees the road," erasing useful general knowledge unrelated to driving. Yet, it is precisely this general knowledge that is most valuable in unfamiliar scenarios—such as encountering a sofa in the middle of the road or a carpet falling off a truck, situations unlikely to appear in training data. Reacting appropriately relies on general common sense.
In real-world production, no Mass production plan (mass-production solution) relies solely on "driving question-answering" to impart driving capabilities.
Xpeng: The second-generation VLA entirely removes the language translation layer, generating actions directly from visual input.
Li Auto: Publicly introduced a three-stage approach: first train a cloud-based foundation model with traffic corpora and visual-language data, then add action data to create a VLA, and finally refine it in a world model using reinforcement learning. Language is only used in the initial stage.
DeepRoute.ai: Developed a proprietary 40B-parameter native VLA foundation model, trained using self-sampled and self-scored simulations.
Huawei, NIO: Do not follow the VLA route; instead, they use world models.
Tesla: Never mentions language in its approach.
However, many display panels use CoT (Chain-of-Thought) reasoning chains solely to show reasons for vehicle control.
The paper also provides an industry-driven rationale called "cabin-driving integration." It argues that future cockpits and intelligent driving systems will share a single chip rather than occupying separate domain controllers, reducing hardware and integration costs. Running a large model on one chip for both intelligent driving and cockpit functions is a promising idea. However, given the current dynamics between lifeifei and lecun yang, it remains uncertain whether language models and spatial models will converge.
Returning to Qwen-Drive, this is currently just a research paradigm. Using language to solve all intelligent driving production challenges still requires addressing latency and other issues discussed later in this article.
In response to the current state of academic research, Qwen-Drive sets three rules for itself: The general brain remains unchanged; an additional 3D output is added to preserve most general capabilities while enabling the VLA model to learn driving.
What It Looks Like: A Fixed Foundation with Two External Modules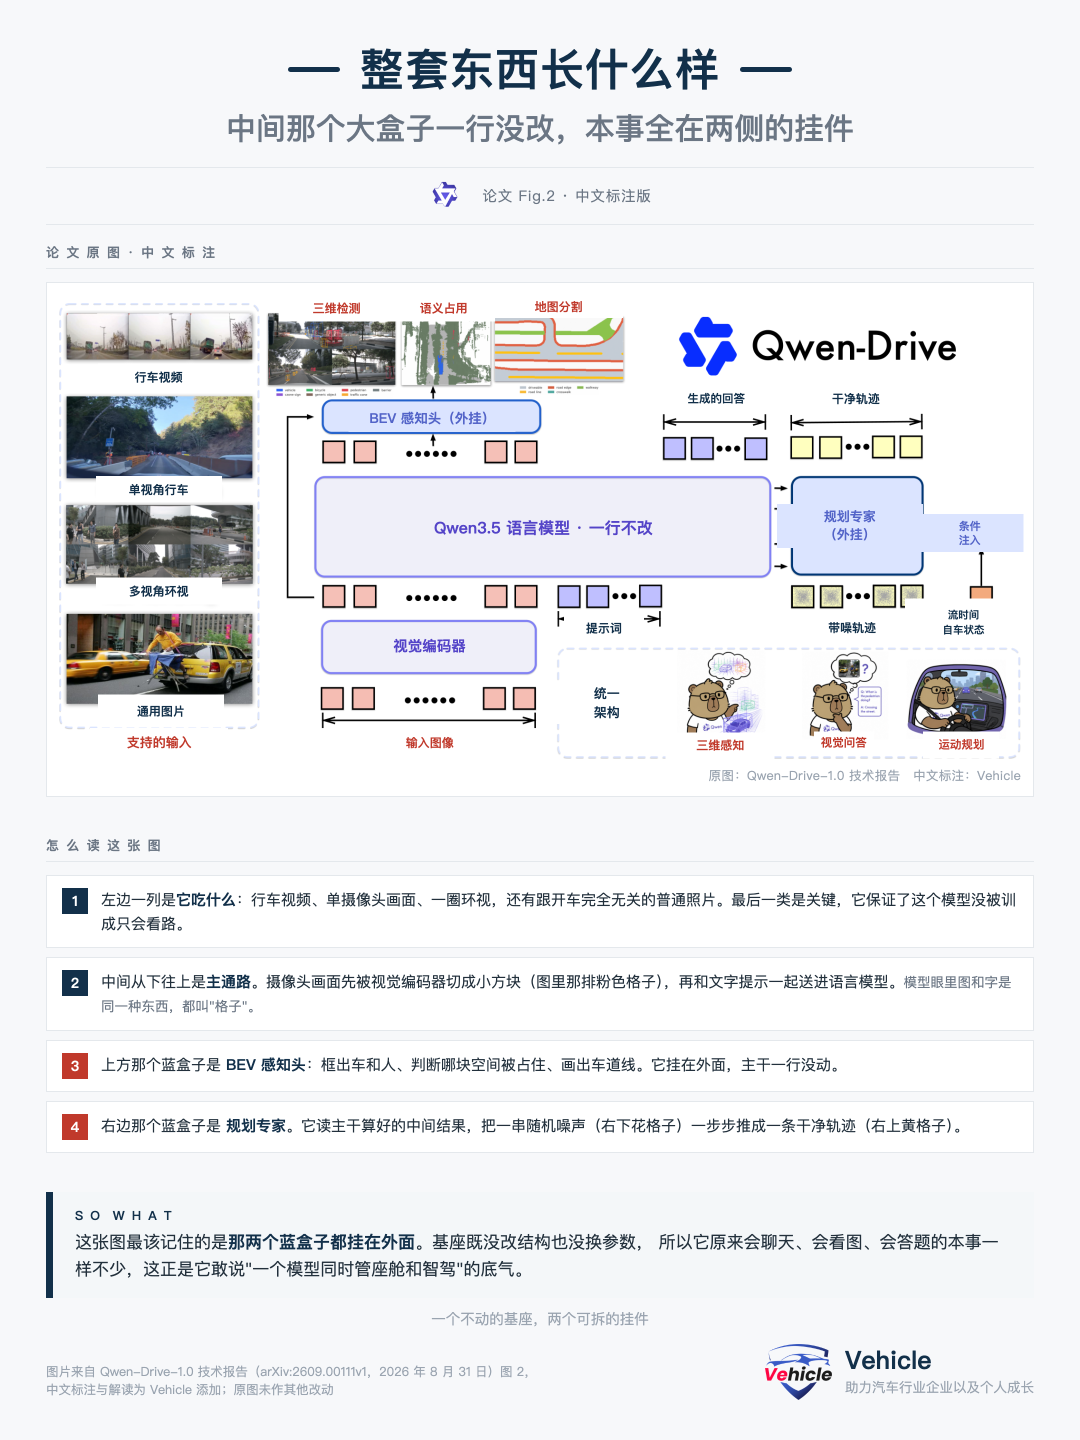
Original paper diagram (Fig.2) with Chinese annotations: The central box remains unmodified.
The entire system can be summarized in one sentence: A VLM model serves as an unchanged general brain, with two external modules attached to its left and right.
The Central Pathway
Camera footage first passes through a "ViT visual encoder," which divides it into small patches and converts them into tokens (for an explanation of ViT, see our previous article: Xpeng's Second-Generation VLA Teardown). Text prompts (e.g., navigation instructions like "turn right at the next intersection") are also tokenized and fed into the language model along with the visual tokens.
The language model has 32 layers, with only 8 layers using the standard "each token compares with all tokens" algorithm. The remaining 24 layers use a computationally efficient simplified version. This hybrid design saves resources when processing long sequences.
How does the model distinguish between footage from multiple cameras and time instances? By using plain text as labels: Each image is prefixed with labels like "front view," "left front view," and "frame number."
What's Inside the Two External Modules
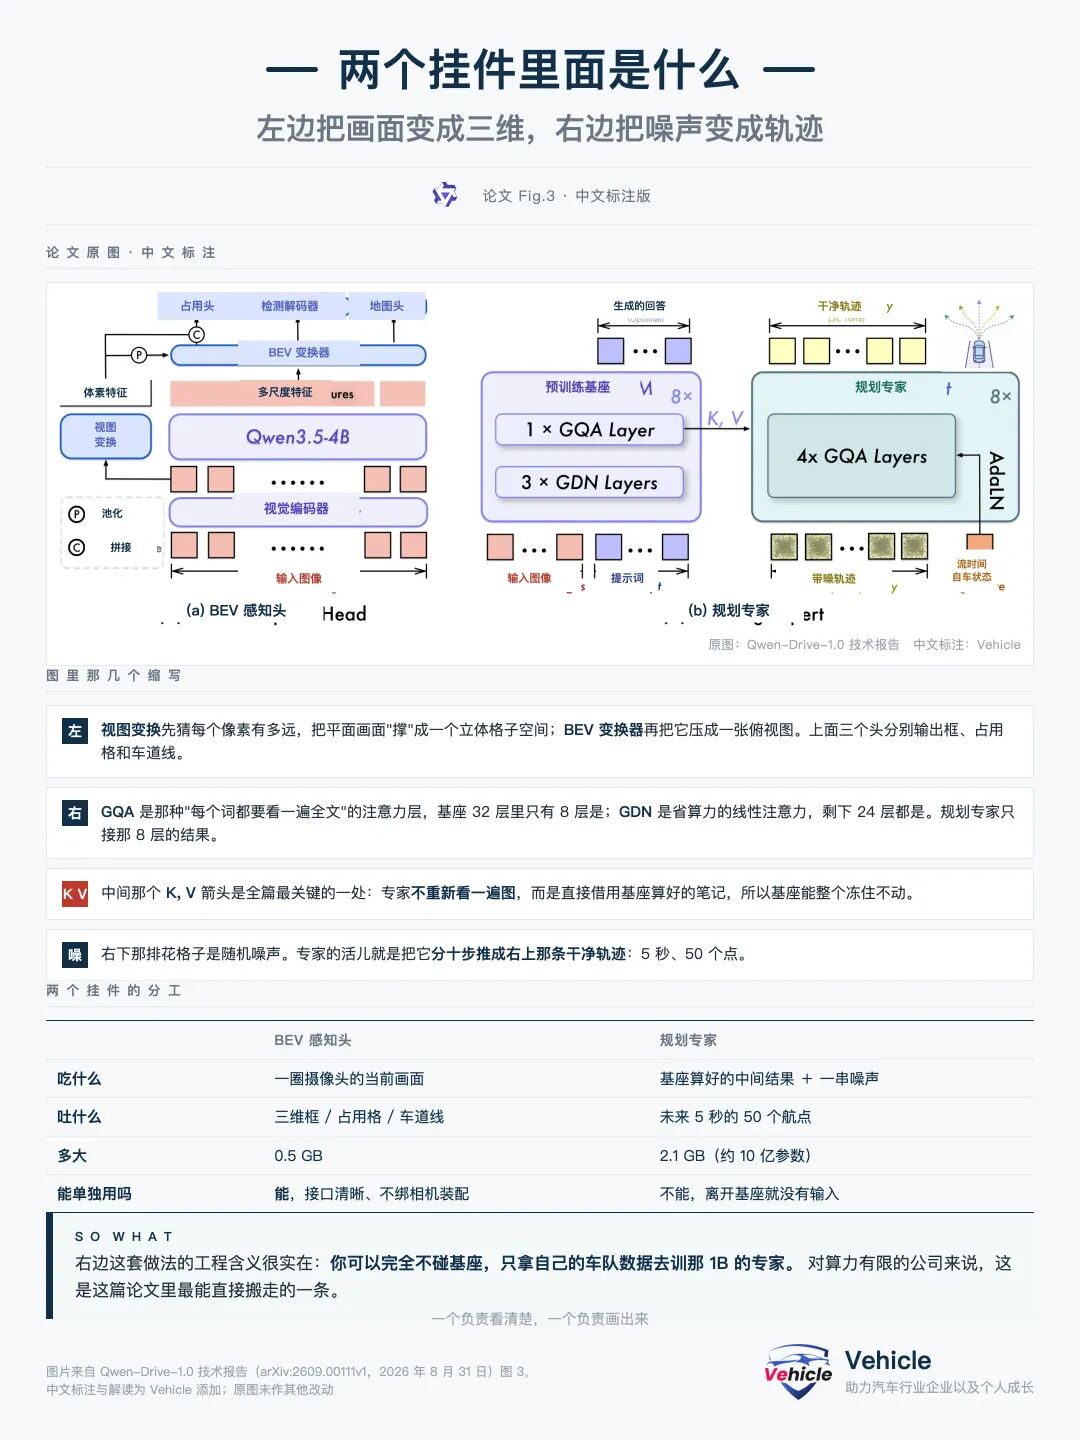
Original paper diagram (Fig.3) with Chinese annotations: The left module converts images to 3D, and the right module converts noise to trajectories.
The left module, called the BEV perception head, converts images into three directly usable outputs: 3D bounding boxes, semantic occupancy grids, and lane maps.
Internally, it first estimates the approximate distance of each pixel in the image, transforming the flat photo into a 3D grid space. This grid is then flattened into a bird's-eye view, and three separate branches generate the outputs.
A clever design choice is the flexible perception head algorithm, which uses a single set of parameters to handle both six-camera and eight-camera setups regardless of their positions. This production-oriented approach means that changing vehicle models does not necessarily require retraining.
The right module, called the planning expert, has approximately 1B (one billion) parameters and outputs a five-second driving trajectory: fifty waypoints, each containing position and heading.
It works by first generating random noise, then gradually "pushing" this chaos into a smooth trajectory over ten steps. This method, called flow matching, was also mentioned in our Xpeng article. Widely used in robotics, flow matching is rapidly replacing diffusion models in autonomous driving and robot trajectory generation research because it produces trajectories without the early-stage random jitters of diffusion models. Each step's vector field smoothly guides the noise toward physically feasible driving paths.
Why not directly compute a trajectory? Because many road scenarios have multiple valid solutions. If a car is blocking the road, both left and right detours are acceptable. Forcing the model to learn only one solution results in a "compromise" trajectory—driving straight into the obstacle. Sampling from noise ensures the model retains the ability to explore multiple valid options.
Another engineering-critical design choice: The planning expert does not reprocess the images; instead, it reuses intermediate results already computed by the main model. The K and V arrows in the diagram represent this data flow. This allows the main model to remain fixed while only the 1B-parameter planning expert is trained.
What It Can Actually Do
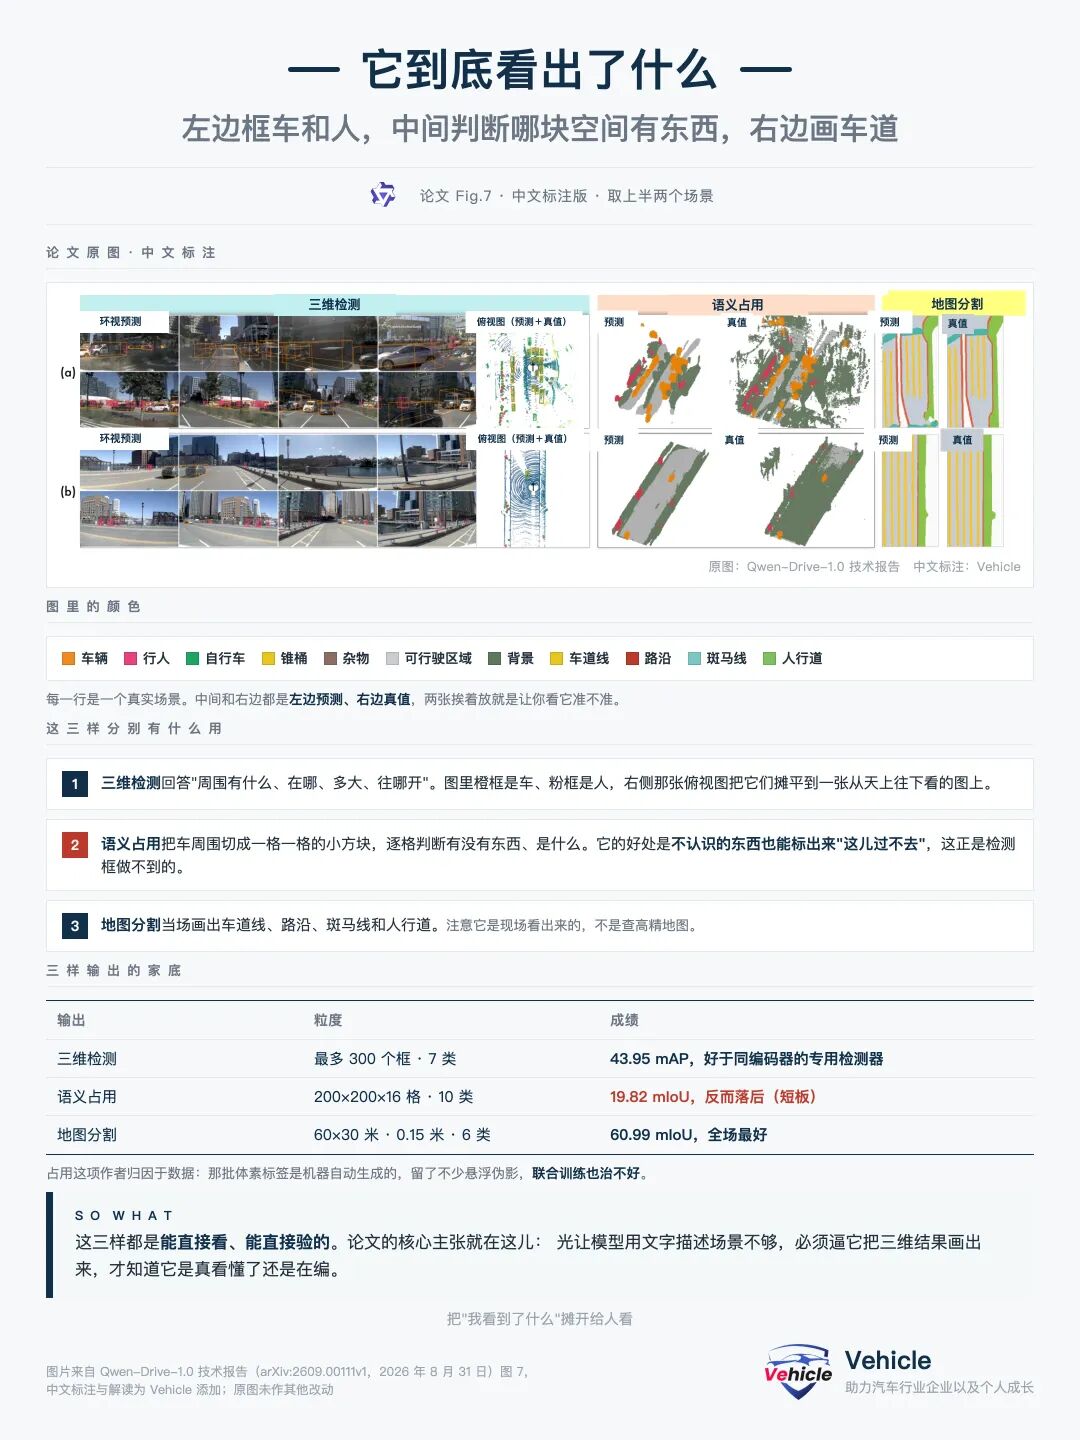
Original paper diagram (Fig.7) with Chinese annotations: Left detects vehicles and pedestrians, middle identifies occupied space, and right maps lanes.
This diagram from the paper provides the most intuitive view, displaying the model's three outputs side by side with ground truth for direct comparison.
The "semantic occupancy" in the middle is similar to Occupancy Networks (Occ), a crucial component in pure vision-based solutions. It divides the space around the vehicle into small grids, determining whether each grid is occupied and by what. Its advantage is that it can mark unknown objects as "impassable." Detection boxes can only identify objects the model recognizes; a carpet fallen from a truck would go unnoticed, but occupancy grids mark it regardless of its identity.
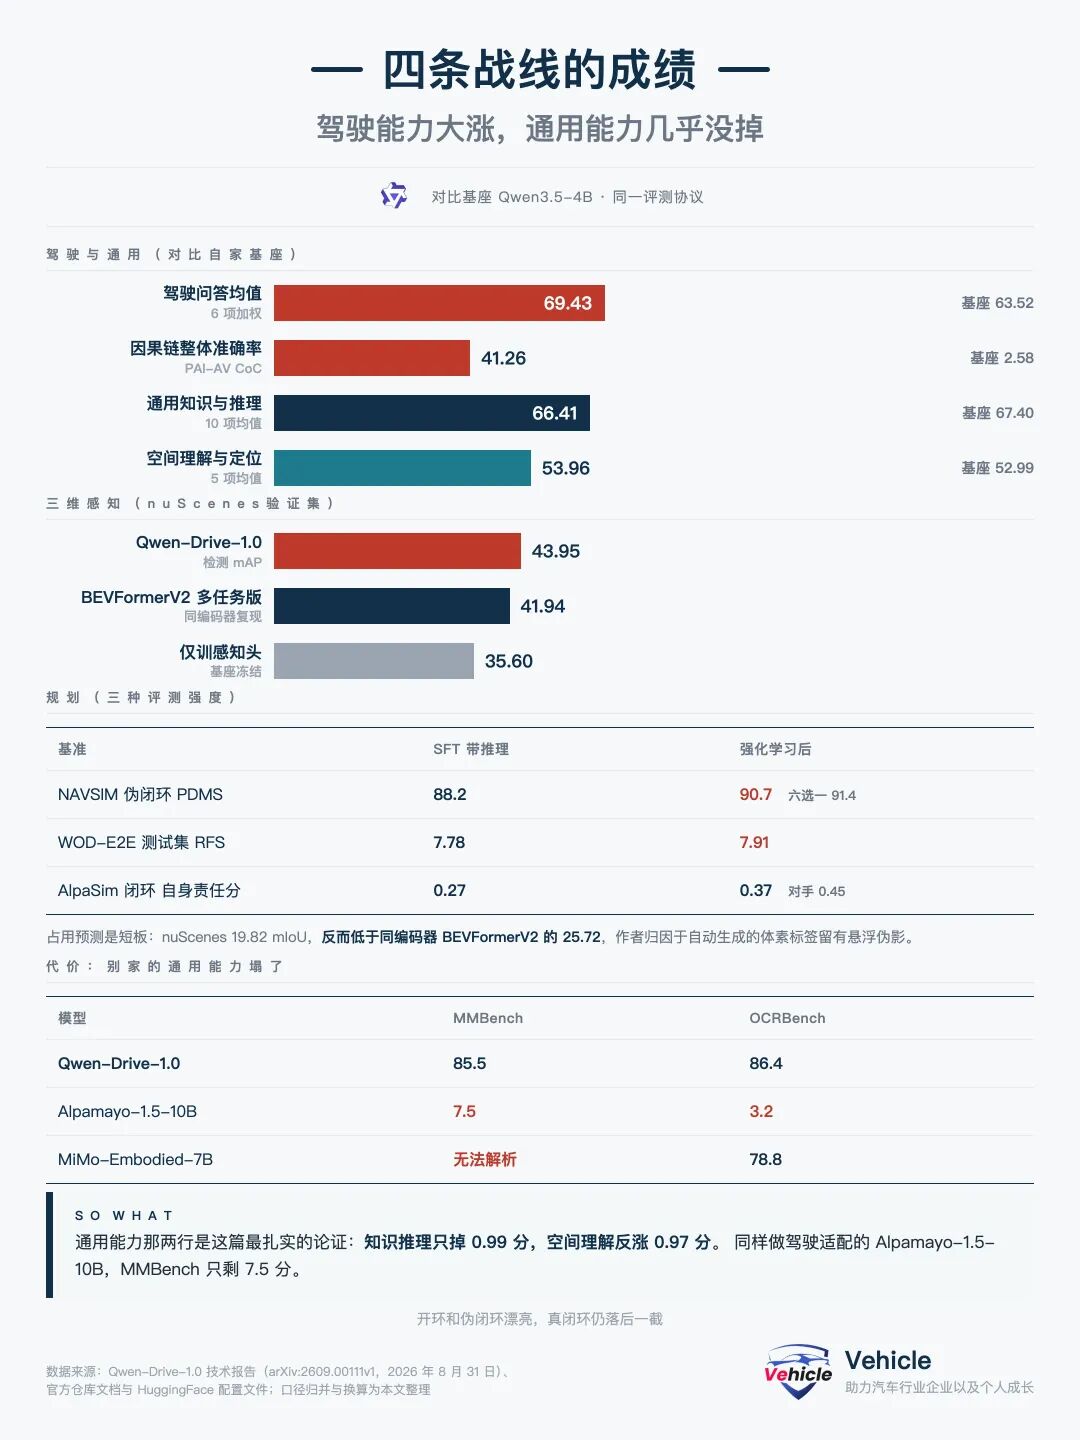
Driving capabilities improve significantly while general abilities remain largely intact—this is its strongest argument. Perception: On par with specialized detectors, but occupancy networks are a weakness.
Compared to the authors' own replicated baselines under the same resolution and training epochs, Qwen-Drive achieves the best performance in detecting objects and lane lines, with a detection accuracy of 43.95, surpassing specialized detectors under identical conditions.
However, it lags in occupancy: 19.82 vs. the baseline's 25.72. The authors attribute this to data issues—the occupancy labels were machine-generated, leaving some "floating" false positives. Whether this fully explains the gap remains unclear, as it is, after all, a research paper.
Driving comprehension: Causal reasoning shows order-of-magnitude improvements.
Causal reasoning tests do not ask "how many cars are in the image" but rather "why did you slow down," then checks whether the model's stated reason matches its actual actions.
The performance gap here is staggering: Qwen-Drive scores 41.26, while its base model scores only 2.58. The second-best general model scores 4.01, and a much larger 32B-parameter model scores just 5.73. In plain terms: Most models can describe scenes but cannot explain "which object caused me to brake." On an internal Chinese urban driving decision-making test, Qwen-Drive scores 71, compared to the base model's 59. Notably, its training data contained no similar Chinese questions, indicating that this decision-making ability was not memorized.
This is easily explained, as driving comprehension was a focal point of its training.
General abilities: This is its most robust argument.
Tested across fourteen public datasets divided into two groups, Qwen-Drive scores 66.41 in knowledge and reasoning (vs. the base model's 67.40, a difference of less than one point) and 53.96 in spatial understanding (vs. the base model's 52.99, slightly higher).
The performance of control groups is revealing. Another hundred-billion-parameter model modified for driving scored only 7.5 on general tests, effectively crippled. Several other models outputted gibberish in some tests, making scoring impossible. Qwen-Drive demonstrates that it is possible to learn driving while preserving general abilities.
Planning: Impressive on paper, weaker in real-world driving.
The paper evaluates path planning ability using three increasingly strict tests:
Open-loop: The model generates a trajectory given a road scenario, compared to human driving. Like a test—wrong answers do not affect subsequent questions.
Pseudo-closed-loop: The generated trajectory is simulated briefly according to vehicle physics and scored, but surrounding vehicles follow prerecorded footage and do not react to the model's actions.
Closed-loop: The model drives in a simulation where the environment responds to its actions, and errors accumulate.
Qwen-Drive performs well on the first two tests, scoring 90.7 in pseudo-closed-loop, ranking high on public leaderboards. However, it struggles in closed-loop testing. In the same simulation, it scores 0.37 vs. competitors' 0.45 in overall score, with 48% driving progress vs. 59% for competitors. Reinforcement learning reduces out-of-bounds incidents from 24% to 12% but makes the model more conservative and slower.
The authors suggest that the model "does not observe frequently enough"—it processes only four frames within 1.5 seconds at 0.5-second intervals, while competitors use denser 0.4-second intervals. With a wider but sparser history, it reacts slower to sudden events.
The paper also debunks closed-loop metrics. One competitor model scores 0.53 in "self-responsibility score" (the highest), but its driving progress is only 35%. The authors found it often remains stationary—no self-caused accidents occur when stationary, and since the score is calculated as distance driven divided by accident count, a small denominator inflates the score. However, it remains vulnerable to rear-end collisions, resulting in a 56% overall accident rate. Another model suffers from the opposite issue: aggressive driving with 62% progress but a 22% self-caused accident rate.
This highlights a key point: When evaluating models, one must consider progress, accidents, and overall score together. Focusing on any single metric can be misleading.
This aligns with Toyota's concept of "digital metrics" from our previous article. When multidimensional evaluation is possible, never rely on a single number.
How was this model trained? 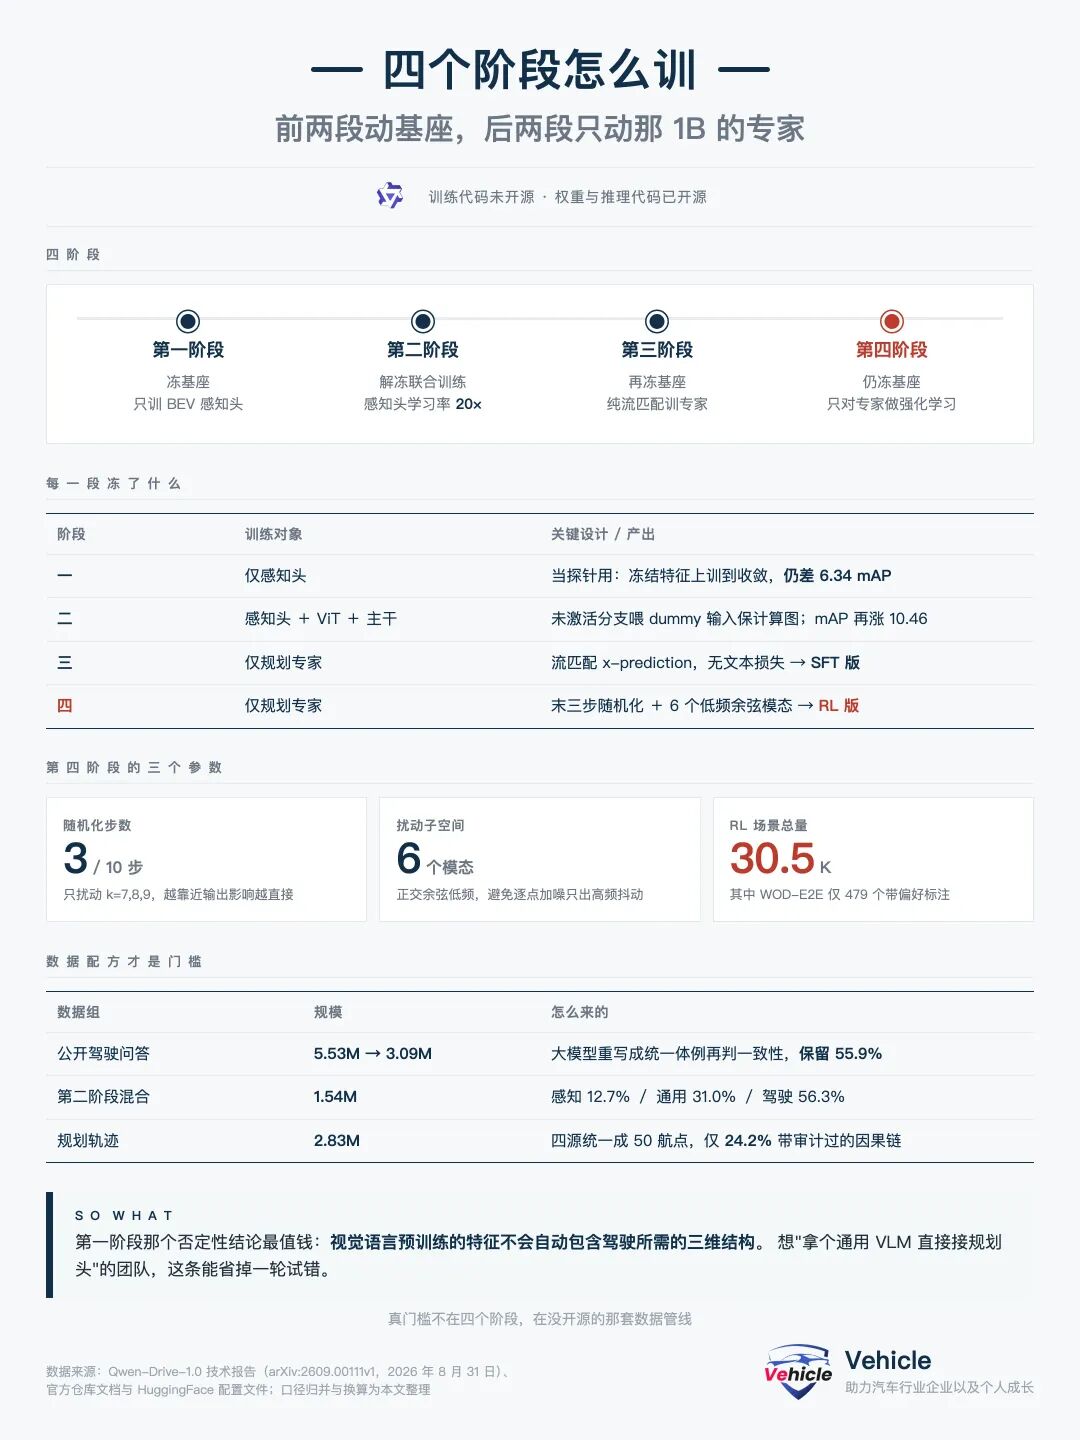
Original paper image (Fig.4) with Chinese annotations: The flame indicates what is being trained in this round, while the snowflake is locked and must remain unchanged.
Training is divided into four stages. The easiest way to understand it is to think of it as training an apprentice.
Stage 1: Let the new apprentice start on their own
Lock the entire general-purpose brain and only train the newly added BEV perception head. On the surface, this step is a warm-up, but its real value lies in performing a clean diagnosis.
Result: Even after training the perception head to its best on the locked general-purpose brain, it still scores 6.34 points lower than a dedicated detector under the same conditions.
This conclusion is proven indirectly, which is why it’s valuable. There’s a naive expectation in the industry that since general-purpose large models have seen so many images, they should already "understand" 3D internally and could work with just a head attached. This experiment shows that’s not true. What’s learned from image captioning is fundamentally different from what’s needed to judge distances. To achieve the latter, the training signals for 3D tasks must propagate back to reshape the brain itself.
Teams working on end-to-end models can directly cite this conclusion to avoid repeating this trial and error.
Stage 2: The master trains alongside
Unlock and train the perception head, visual encoder, and language model together. The effect is significant: detection accuracy improves by 10.46 points, and lane line detection by 9.84 points compared to Stage 1. Since the perception head in Stage 1 was already fully trained, these gains can only come from one thing: the general-purpose brain itself has been reshaped.
Stage 3: Train a new apprentice to drive alone
The VLM brain is locked again, and only the planning expert is trained to purely learn "how to draw trajectories." Text generation is completely ignored in this stage.
Stage 4: Let it hit the road, make mistakes, and adjust based on results
The first three stages are "copying standard answers": The data records how humans actually drove, and the model learns to replicate that. But in reality, there’s only one correct answer to a problem, while there are often multiple reasonable ways to drive.
So Stage 4 switches to a different approach: The model generates eight different candidate trajectories for the same scene, a scorer evaluates each one, and adjustments are made toward higher-scoring trajectories. This is reinforcement learning (RL).
Where’s the challenge? As mentioned earlier, the planning expert generates trajectories in ten steps from random noise. Once the initial noise is set, the next ten steps are entirely deterministic, with no "adjustable choice points" for RL to intervene.
The authors’ solution is clever in two ways. First, randomness is introduced only in the last three steps. Perturbations closer to the endpoint have a more direct impact on the final result, while early perturbations are smoothed out by subsequent steps. Focusing exploration near the exit captures differences without going off track. Second, instead of adding random jitter to each point, they apply whole-line translations and bends. If each waypoint had its own randomness, the result would be a jagged line with no meaningful driving differences among the eight candidates. By restricting perturbations to six "low-frequency waveforms," the differences become practical maneuvers like "swerve slightly left" or "turn earlier here."
Designing the rewards is also tricky because the three data sources have entirely different scoring criteria. Some use a composite driving score, some rely on human raters’ preferences, and one data source has no scoring at all—it simply measures "how far off the recording" the trajectory is, with the highest weight given to errors in the first second because near-term errors directly determine steering actions.
This stage uses surprisingly little data: 15,000 scenes + 15,000 scenes + 479 scenes with human preference annotations.
The real bottleneck is the data recipe
The model architecture can be replicated from the paper, but the data is what truly blocks people.
The perception data in this paper uses two public datasets: one with 28,000 frames and another with 600,000 frames. The problem is their annotation standards are completely different: one classifies vehicles into five categories (sedan, truck, trailer, bus, construction vehicle), while the other uses a single "vehicle" label. Some categories exist in one dataset but not the other. The authors’ solution is to unify to the coarsest granularity compatible with both, letting only the dataset containing a unique category handle it.
There’s also a finer challenge. Both datasets use 200×200×16 occupancy grids, but their actual coverage differs: one spans 40 meters in all directions, the other 50 meters; one uses 0.4 meters per cell, the other 0.5 meters; even the coordinate origins on the vehicle differ by about 1.84 meters in height. Forcing alignment would cause misregistration, while resampling would blur the labels. The authors’ solution is to keep the native grids and perform a differentiable resampling at the model’s output to align them, using a single module to handle both grids without branching.
The language data aggregates 24 public driving Q&A datasets. These datasets have wildly varying formats, and many answers are template-generated or machine-produced, leading to inconsistent quality. The authors’ pipeline has two steps: First, a large model rewrites all questions and answers into a unified format. Then, another model checks if the rewritten answer matches the original annotation, keeping only consistent ones. This cuts 5.53 million entries to 3.09 million, retaining just 55.9%.
The self-built portion fills gaps in public data. The most critical part is the causal chain—what the industry calls Chain-of-Thought (CoT): It infers "what actions were taken" from the human-driven trajectory, then uses a stronger model to write "why those actions were taken" based on the visuals, followed by an audit. The audit is cleverly designed: Instead of having a model score explanations, it presents multiple-choice questions and programmatically aggregates the answers. The audit checks if the inferred actions match the actual trajectory and specifically removes explanations that "peek into the future." Two other self-built components are having the model recognize the chronological order of surround-view images and 30,000 traffic light and detection tasks for domestic road conditions.
The planning data aggregates 2.83 million entries from four sources. One dataset provides positions at 4 FPS, which the authors interpolated to 10 FPS and discovered the acceleration field in the original data needed a 4× correction factor. Anyone trying to replicate this will encounter this issue.
The latency problem—what the paper doesn’t mention but matters most for production
The paper provides no latency numbers—no frame rate, no real-world tests on automotive-grade chips, no compression schemes. It only recommends "GPUs with at least 24 GB VRAM."
But it discloses all parameters needed to infer latency. The numbers below come from its config files and paper text.
First, build intuition: The model works in two phases—reading the question and answering it. Reading processes all inputs in parallel (like a room of people reading different pages of a book simultaneously), depending on compute power. Answering generates output token by token, requiring a full model forward pass for each token (the next token can’t start until the previous one is done), depending on memory bandwidth.
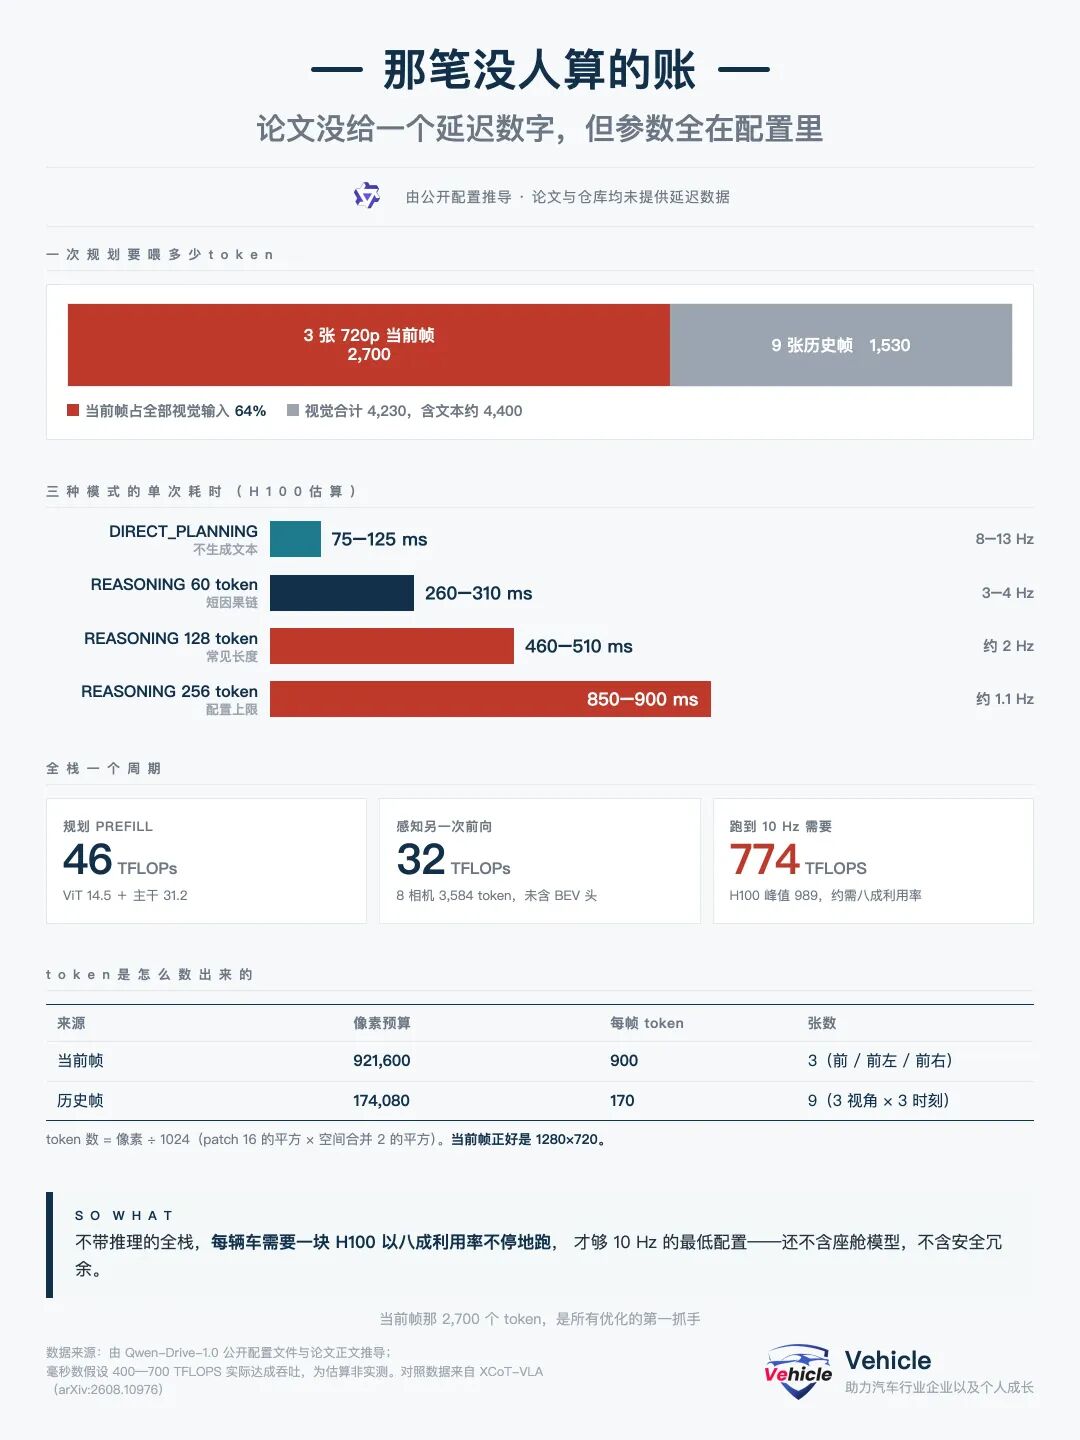
The current frame’s 2,700 tokens account for 64% of all visual inputs—start by counting cells
The config files hardcode pixel limits per image. For the current frame, that’s 900 tokens; historical frames use 170 each. Planning requires three views, each with four timestamps (current + three historical frames from 0.5s ago):
Current frame: 3 × 900 = 2,700
Historical frames: 9 × 170 = 1,530
Total visuals: 4,230, plus text prompts ~4,400
Now calculate timing for three modes
To convert compute to time, I assume data center-grade GPU performance (estimation, not measurement):
Direct planning: ~75–125 ms (~8–13 Hz)
With 60-word rationale: ~260–310 ms (~3–4 Hz)
With 128-word rationale: ~460–510 ms (~2 Hz)
Max-length rationale: ~850–900 ms (~1 Hz)
Add perception: The eight cameras require another full forward pass, effectively rerunning the main model.
Total for both pathways, without rationale: ~770 trillion FLOPs per round. To run at 10 Hz, you need ~7.74 petaFLOPS sustained.
For reference, an H100 data center GPU peaks at 989 TFLOPS. This means each vehicle needs an H100 running at ~80% utilization nonstop just for the minimal configuration—excluding cabin models or safety redundancy.
Why it gets worse on vehicles
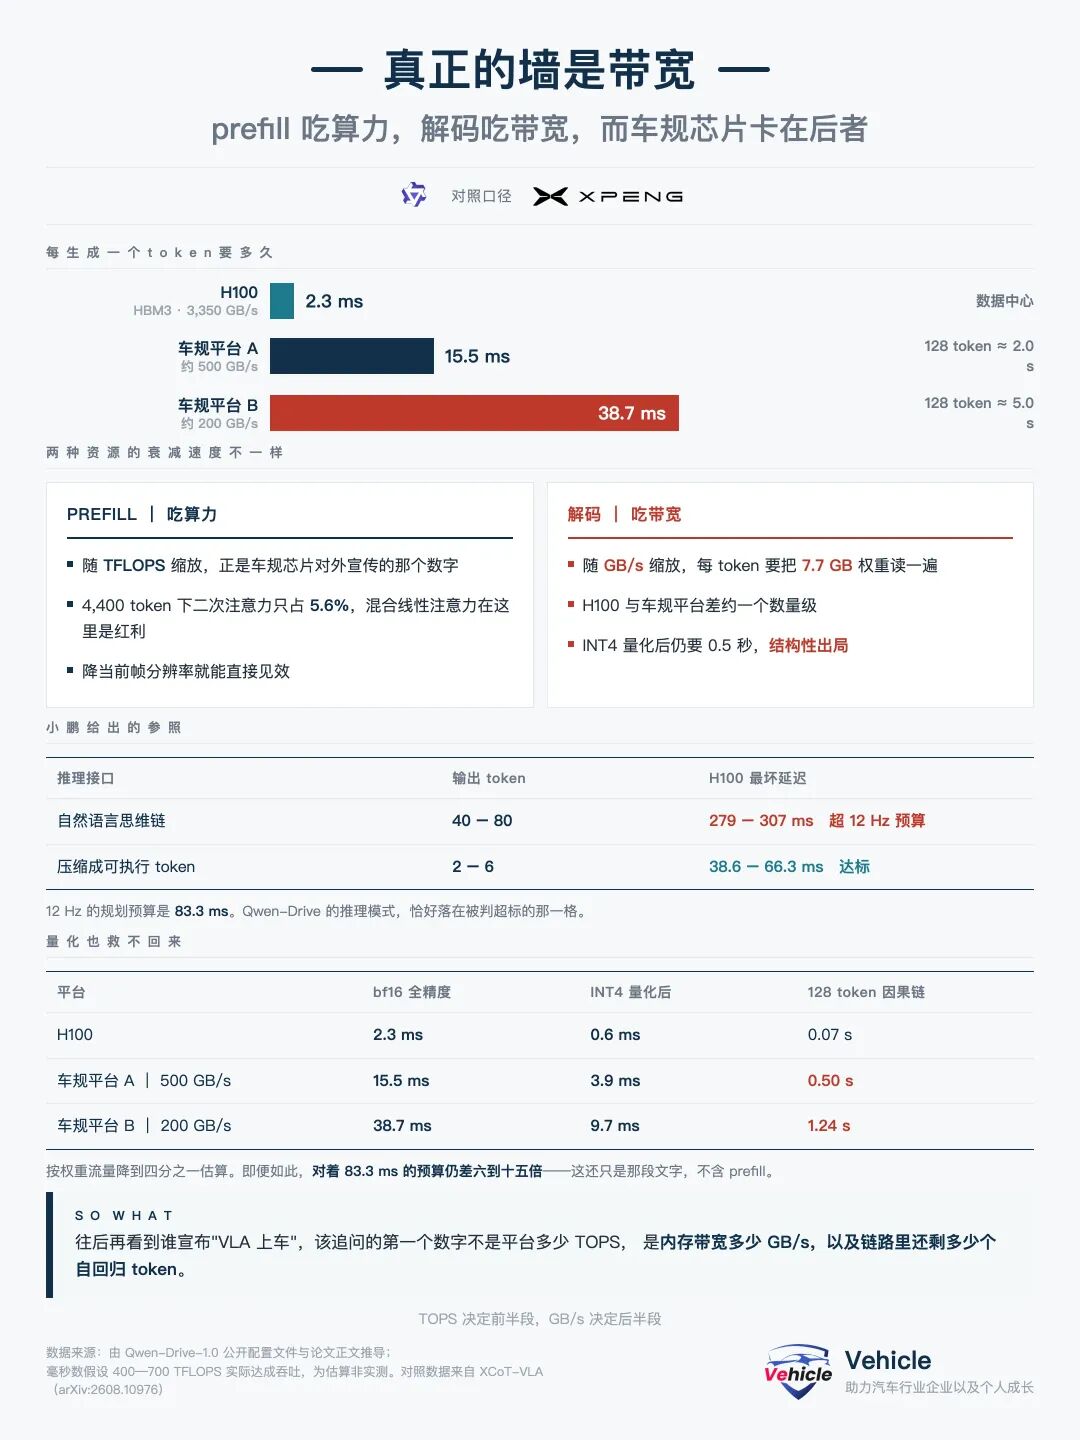
Compute determines the reading phase; memory bandwidth determines the answering phase. Automotive chips are bottlenecked on the latter.
This is the most easily obscured point by "X TOPS on vehicle" claims. Recall the reading/answering analogy: Reading needs compute, answering needs memory bandwidth. Automotive chips today have high compute claims but lag in memory bandwidth.
By the numbers: Each output token requires reading ~7.7 GB of parameters from memory. A data center GPU with 3,350 GB/s bandwidth takes 2.3 ms per read. An automotive platform with 500 GB/s takes 15.5 ms; NVIDIA’s current high-performance automotive chip (Thor) does 273 GB/s—at 200 GB/s, it’d take 38.7 ms.
A 128-word rationale would take 2.0s and 5.0s on these platforms, respectively.
Can compression help? Cutting parameters to 1/4 their size still leaves 0.5s on a 500 GB/s platform. That’s just for the text, excluding reading the question—five times over the 100 ms budget. Rationale-based modes aren’t salvageable by compression; they’re structurally unviable.
As evidence, XPENG’s paper reported real-world tests: On the same GPU tier, writing 40–80 natural language words takes 279–307 ms (all over their 83.3 ms budget). Compressing to 2–6 "action words" reduces it to 38.6–66.3 ms (meets budget). Qwen-Drive’s rationale mode falls into the over-budget category.
There’s also a subtler issue
Earlier, I mentioned that planning visuals arrange frames as "consecutive timestamps from the same view" to help the model detect changes in that direction.
The cost: Each time the time window advances, all four frames in each view shift, so the second frame moves to the first position. All sequence indices change, invalidating all intermediate results from the previous round. Every round must recompute all 4,400 tokens from scratch.
In contrast, XPENG’s approach uses a "compressed memory" mechanism that condenses 30 seconds of history into a fixed-size note retained across rounds, with new visuals added incrementally without recomputation. This is what makes "think while driving" feasible. Qwen-Drive’s arrangement rules this out by design, not oversight.
Before concluding, there’s one unmentioned optimization in the config files: A multi-token prediction head that enables a speedup trick—"guess multiple tokens at once, then verify"—cutting the answering phase’s time by ~half. The paper doesn’t mention this; neither does the repository’s documentation. The capability exists in the weights, but no one tells you.
What can ordinary companies do with this?
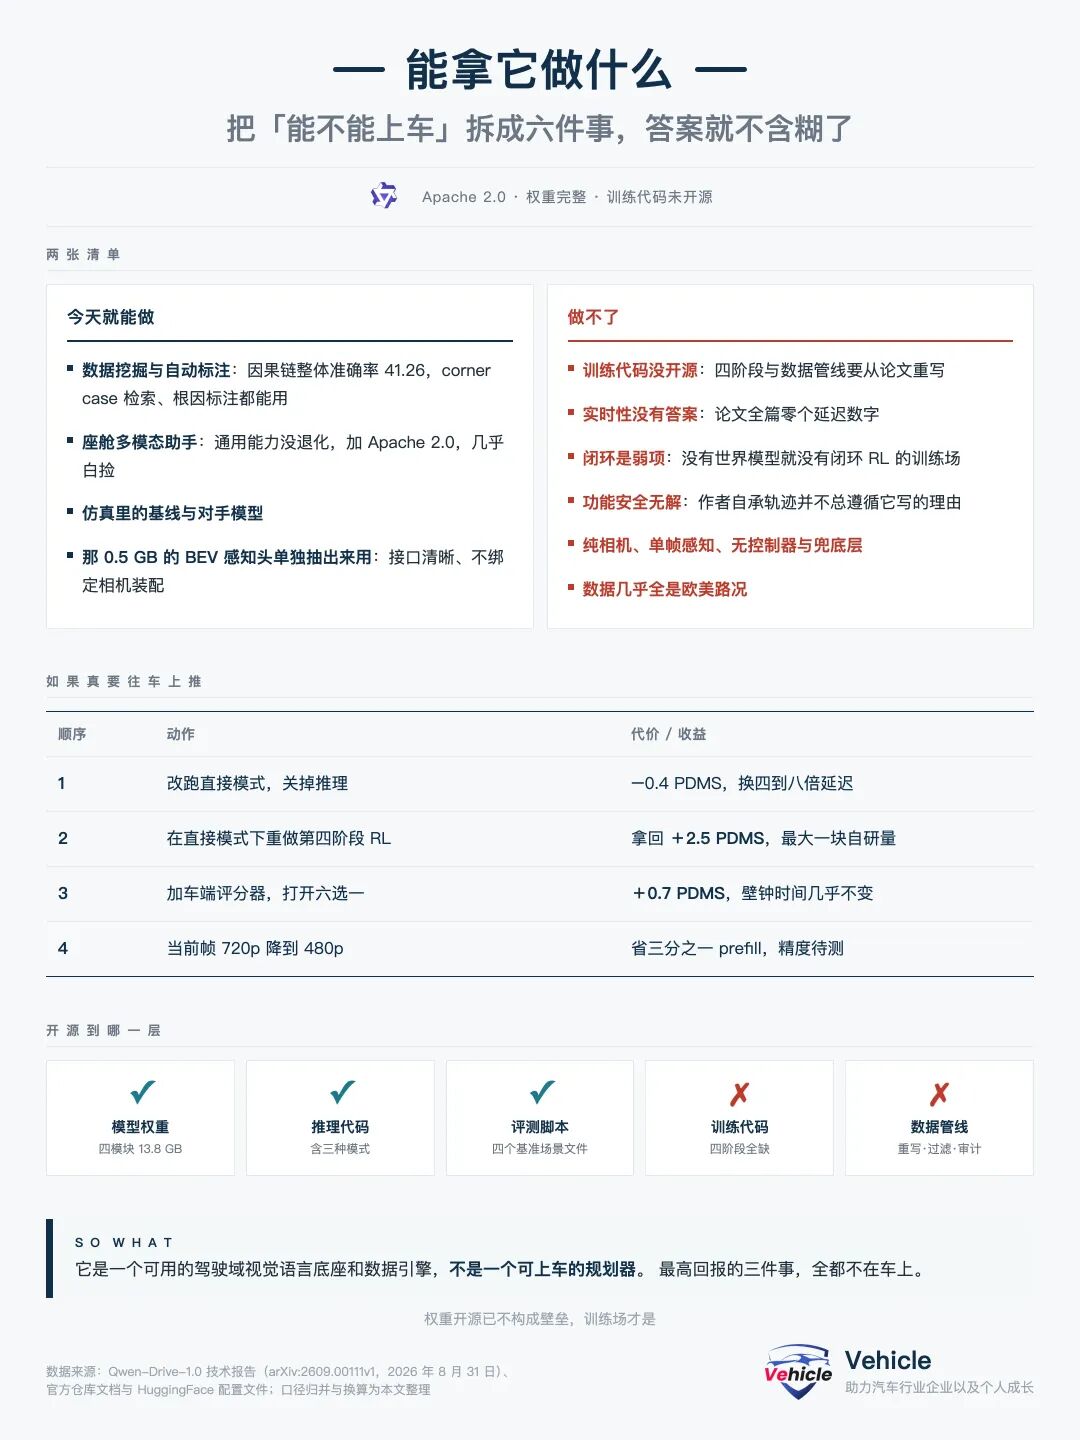
Breaking "vehicle viability" into six parts makes the answer clear—what you can do today
Qwen is Apache 2.0 licensed, fully open-source, and commercially usable. The weights are complete; a 24 GB GPU can run it.
What can you do?
1.Data mining and auto-annotation: The 41-point causal reasoning score is genuinely valuable for annotation pipelines. Given a driving video, it can explain "why the driver braked sharply" and retrieve semantically similar scenes—tasks now done manually at high cost.
2.Cabin assistant (Qwen is already open-source for this).
3.Baseline and training partner in simulation.
4.The 0.5 GB BEV perception module can be extracted and used standalone. It has clean interfaces, documented coordinate conventions, and no camera layout binding—available freely on GitHub.
What you can’t do
Using this concept/model for self-driving is impractical.
Training code isn’t open-sourced. Only inference code and weights are provided. Replicating the four training stages on your own data requires rewriting from the paper. While the paper is detailed (all parameters given), turning it into runnable training code takes months. The data pipeline faces the same issue: rewriting, filtering, auditing, and label unification are described but no tools are provided.
Real-time performance is unsolved. The latency breakdown earlier covers this; the most expensive phase is precisely the configuration that scores best.
Closed-loop learning is weak, limited by data infrastructure. To do closed-loop RL, you need a realistic simulator for trial-and-error. Qwen-Drive lacks one, relying on others’ offline scorers across just 30,000+ scenes. The paper warns against treating pseudo-closed-loop scores as real driving quality proxies.
Functional safety is unaddressed. No industry consensus exists on certifying a 5B-parameter generative model under automotive safety standards. The paper’s limitation section admits a painful truth: Its generated trajectories don’t always follow their own written rationales. The authors acknowledge that rationale-based scoring gains might come from stuffing more context into the prompt via self-questioning, not genuine understanding. In other words, its explanations aren’t guaranteed to be its decision basis—a cold shower for any company banking on "explainability" for safety arguments.
Pure camera, no fusion. No LiDAR or millimeter-wave radar. Perception relies solely on the current frame, with no downstream controller, no safety fallback, and no degradation strategy. It outputs a five-second trajectory, not steering wheel angles, and the vehicle lacks an entire system to convert trajectories into actions and take over when it makes mistakes.
The data is almost entirely from European and U.S. road conditions. While the Chinese decision-making score of 71 demonstrates cross-regional understanding, driving behavior does not automatically transfer. Cut-ins, sudden pedestrian appearances, and electric bikes running red lights vary across regional datasets.
What does this mean for the industry? The barrier to entry for open-source solutions is shifting from models to training grounds.
Models no longer constitute a barrier. A 5B (five billion) parameter model, all four modules included, with a commercial-use license—this was unimaginable two years ago but is now just a routine release.
The real barrier lies in what wasn’t released: four segments of training code, a unified data pipeline, and a causal chain audit process. Even harder to replicate than the training code is the simulation environment that allows the model to repeatedly trial and error. XPENG increased its proprietary simulation scenarios from 30,000 to over 500,000, equivalent to running 30 million kilometers daily; Qwen-Drive can only borrow others’ environments and happens to underperform in this area.
There is a causal link between these two issues. Without a sufficiently realistic simulation environment, reinforcement learning can only be done on offline scorers; reinforcement learning done solely on offline scorers produces models that are "better at gaming the scoring formula" but fail to address the cumulative errors in real-world driving. The next barrier is not in the model but in whether one can build a sufficiently realistic training ground.
Generality and real-time performance are non-negotiable—and there is no middle ground.
Examining each design choice in Qwen-Drive reveals they all point in the same direction: retaining full language output capabilities in exchange for cabin functionality and explainability, at the cost of outputting text one character at a time; high-definition current-frame perception for finer observation and more accurate ranging, at the cost of processing 2,700 grid cells; camera layout-agnostic design for cross-model generality, at the cost of being unable to bake model-specific priors for slimming; explicit 3D output for visibility and verifiability, at the cost of a second full computation across eight cameras; natural language reasoning for auditable explanations, at the cost of 3–10x the computational budget.
Now, consider XPENG’s approach: compressing reasoning into a few action words, retaining compressed memory across rounds, integrating trajectory generation into the main model, trimming redundant image grids, and outputting acceleration for trajectory integration.
From research to production, success hinges more on data and clever balancing. XPENG has achieved balance, but whether it is good or bad remains to be seen—that requires real-world testing.
The engineering framework for cross-dataset unification can be immediately adopted by domestic companies.
Aligning data labeling systems may be a critical consideration for large model training; otherwise, end-to-end models trained on non-end-to-end data will not work.
There are two approaches to cabin-driving integration, and the choice may not be purely technical.
Qwen-Drive argues at length that the cabin and intelligent driving must share a single chip, so the driving model must retain general capabilities to serve both.
However, publicly available information suggests XPENG takes a different path: the cabin runs as an independent assistant pipeline, while intelligent driving operates separately, both sharing a chip but not the same model instance.
This divergence may not stem from technical judgment. Whether cabin and driving systems should resonate in sync remains questionable. Using one model for both saves VRAM and scheduling overhead, while two models sharing a platform reduce coupling risks and iteration friction—the latter is more akin to a production-ready choice.
In closing,
The authors of Qwen-Drive-1.0 call it "the first step toward a foundational driving model," a self-assessment that rings true. It proves that explicit 3D perception and trajectory generation can be added to a general-purpose large model without sacrificing generality, and it releases the full weights along with a highly detailed methodology.
What it has not proven is whether this setup can fit within 100 milliseconds. These two aspects are two sides of the same coin in its design.
Achieving real-time performance will likely require further exploration through engineering implementations. Is Qwen-Drive-1.0 the Deepseek moment for autonomous driving algorithms? Maybe, but it is certainly not something digital AI systems like Deepseek can directly handle.
References and images*Strictly prohibited from reproduction or excerpting without permission-
-
![]()
The Loss Conundrum and the High-End Wager: Xiang Xingchu Declares, 'JAC Embarks on Its Third Trailblazing Journey'
-
![]()
'Problematic Stock' Plummets for a Decade, Then Suddenly Surges to Limit Up for Two Straight Days! Is the Auto Sector Making a Resurgence?
-
Value and Cost: Validations from Anthropic and Zhipu
-
![]()
Eliminating Set-Top Boxes: A Panacea for the TV Industry’s Woes?
-
Who Defines 'AGI' Defines the Future
-
![]()
What Unfolded Following Tesla's Substantial Price Reduction?
-
![]()
4-Minute Surge: 10,000 Orders Secured for Xiaomi Pengcheng, Sparking Hot Search Trend. Lei Jun: Extended-Range Vehicles Hold Immense Promise
-
The Future Trajectory of AI Large Models