Why Has the Underestimated HDD Become the 'Data Terminal' for AI?
 10/27 2026
 564
In reports on NAND, Dolphin Research previously stated that AI inference has elevated NAND from a 'peripheral data warehouse' to a 'necessity in the computational path,' with SSDs acting as a form of 'token battery' for storage computing power.
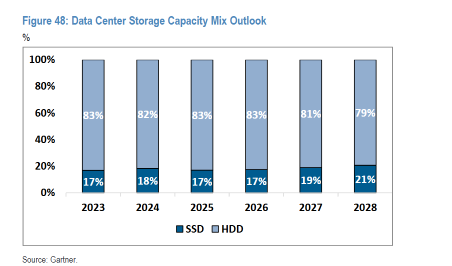
However, the market often overlooks another fact: approximately 80% of cloud-based data is still stored on Hard Disk Drives (HDDs). The vast amounts of data generated by AI will, for the most part, ultimately end up in HDDs, the 'data terminal.'
Over the past decade, as laptops, desktops, and traditional enterprise drives shifted to SSDs, HDD shipments declined for several consecutive years, earning the label of a 'sunset industry.' Western Digital even spun off SanDisk (its NAND business) in February 2025, becoming a pure HDD company.
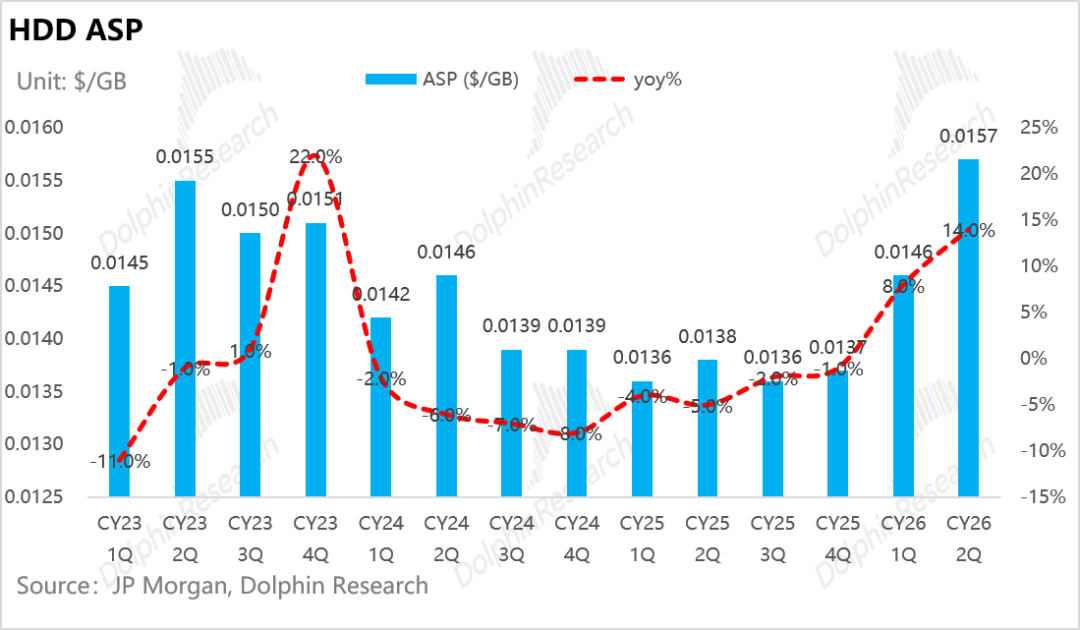
Yet, this 'sunset industry' is now experiencing a rare reversal: in the second quarter of 2026, industry-wide HDD revenue surged by 47% year-over-year, driven by increases in both volume and price—shipment capacity grew by 29% year-over-year, while the average price per GB rose by 14%. The end of multi-year declines in the average price per GB, with prices now rising, signals the conclusion of the prolonged industry downturn.
In this article, Dolphin Research will address the following four questions:
I. What is an HDD? How does it differ from NAND?
II. Why has HDD formed an oligopoly?
III. Why is supply expansion difficult? Can Chinese capacity compete?
IV. Why has the underestimated HDD become the 'data terminal' in the AI era?
Below is a detailed analysis.
I. What is an HDD? How does it differ from NAND?
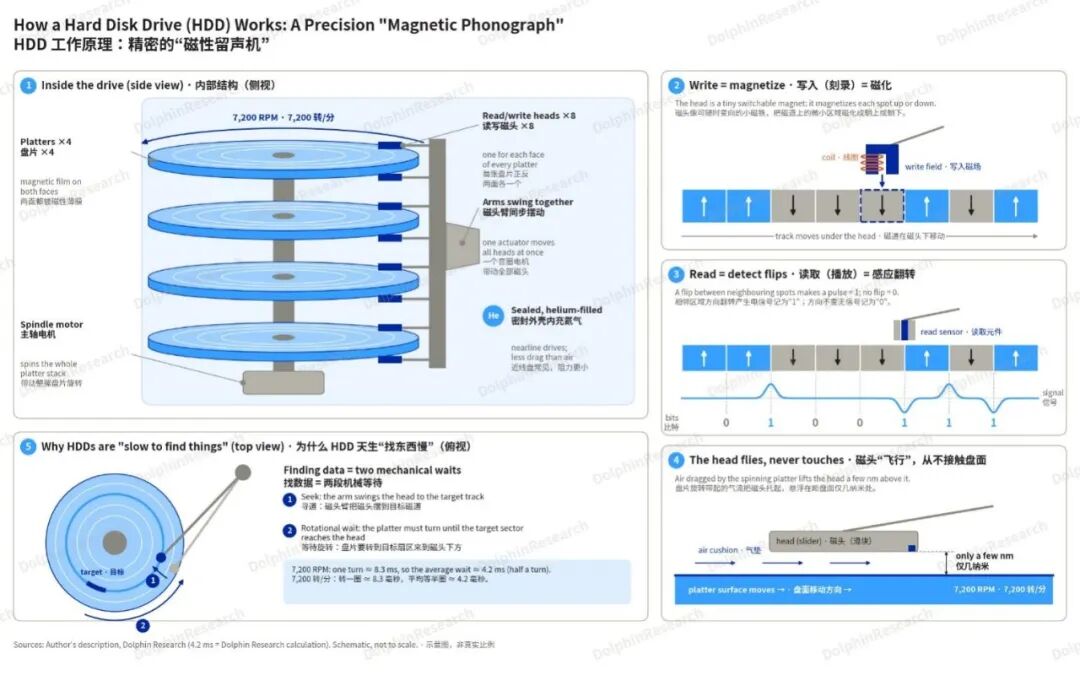
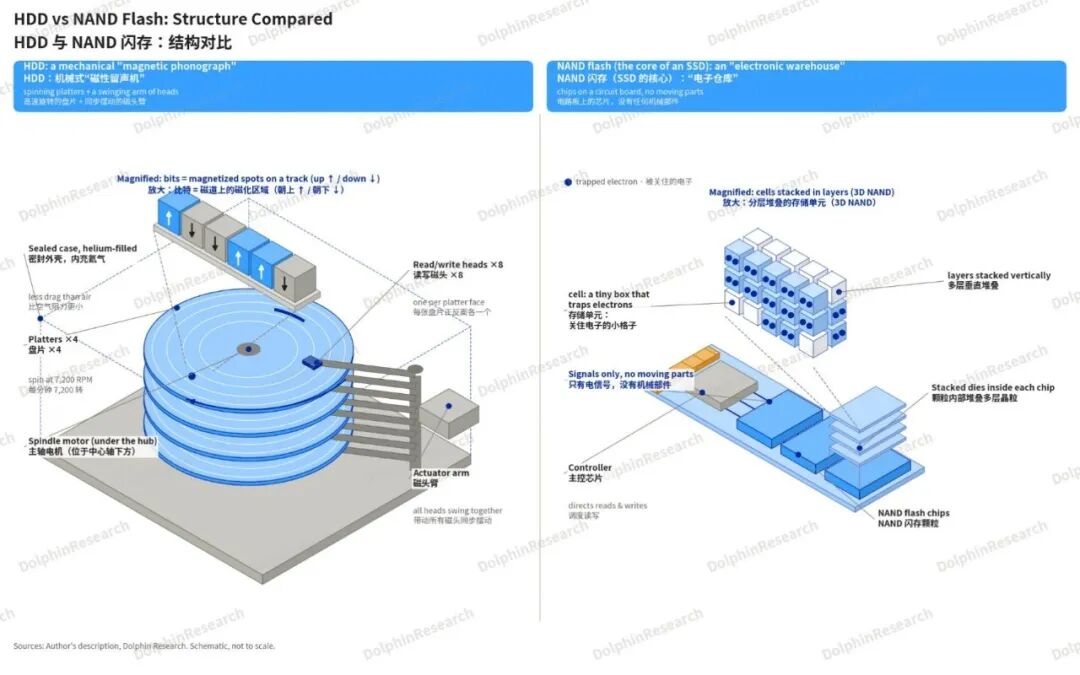
HDDs (Hard Disk Drives) and NAND flash memory (the core of SSDs) represent two extremes in data storage: HDDs are like 'magnetic phonographs,' using magnetic heads to record and read data on spinning platters; NAND is like an 'electronic warehouse,' using circuits to trap electrons in tiny cells. HDDs are inexpensive, offer large capacity, and are durable for repeated writing but are slow to read; NAND offers fast speeds and has no mechanical parts but is expensive and has a limited lifespan for erasing and rewriting.
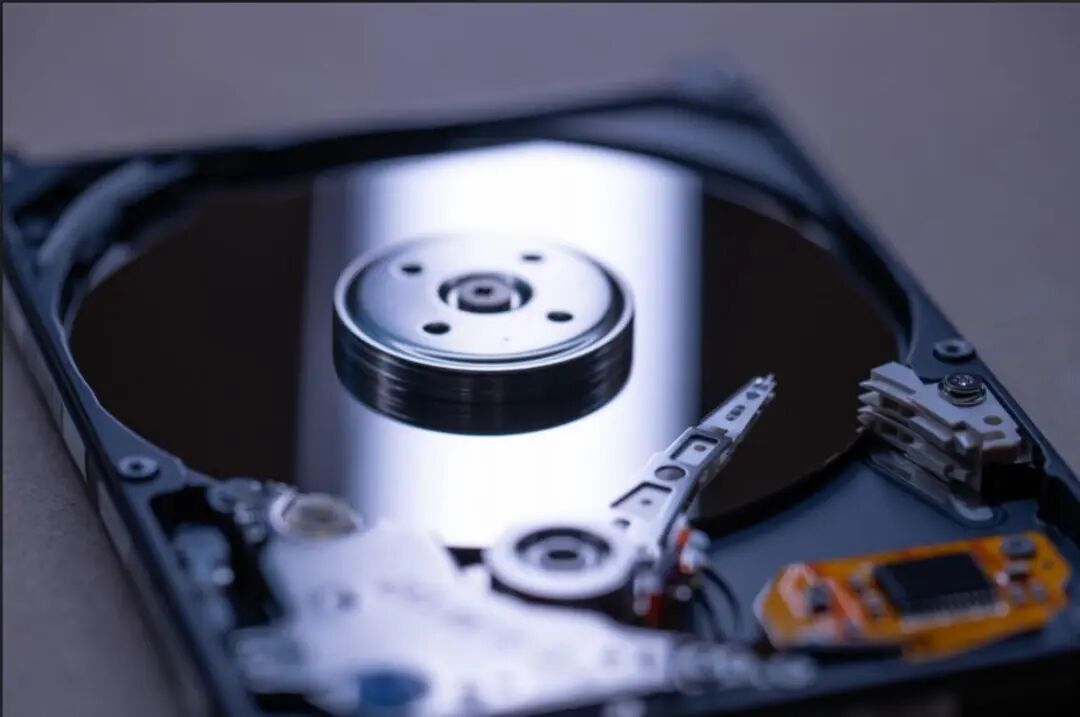
Inside an HDD's casing are a stack of high-speed spinning platters (nearline drives are often filled with helium to reduce resistance) and a set of synchronously swinging head arms. The heads magnetize tiny regions on the tracks to record 0s and 1s, 'flying' just a few nanometers above the platter surface; because they rely on mechanical arms to seek and wait for the platter to rotate to the target position, HDDs are inherently slow at 'finding things.'
NAND, in contrast, has no mechanical parts and is composed of billions of tiny transistors: writing involves 'stuffing' electrons into the transistor's storage layer, while reading determines what is stored based on the conduction voltage.
These fundamental differences determine their performance, use cases, and industrial characteristics:
a. Lifespan: HDDs record data by magnetizing directions, which can be repeatedly flipped without degradation; NAND insulation layers age with each erase-write cycle, limiting the number of such cycles.
b. Speed: HDDs require 5–15 milliseconds for a single random access and can complete only about a hundred per second; NAND responds in tens to a hundred microseconds, with random read-write capabilities hundreds of times higher. Thus, NAND is suitable for frequently accessed 'warm' data, while HDDs are better for 'cool' data primarily read and written sequentially.
c. Manufacturing: HDDs are assembled from components like motors, heads, platters, and casings, requiring a new set of parts for each additional drive; NAND is 'printed' in wafer fabs, with output from the same wafer increasing by about 30% annually simply by stacking more layers, without needing new factories. This is why NAND supply is hard to reduce while HDD supply can be actively controlled by manufacturers.
II. Why has HDD formed an oligopoly?
Before the AI boom, HDD was a mature industry with limited growth, strong cyclicality, and high commoditization, long seen as a 'cash cow in sunset': the oligopoly ensured no significant losses, but growth was slow, volatility high, and demand visibility low.
From the 1990s to the early 2010s, over a dozen manufacturers—including Conner, Quantum, IBM, Maxtor, Fujitsu, Samsung, and Hitachi—were locked in a battle for market share and price wars, leaving industry profitability extremely fragile.
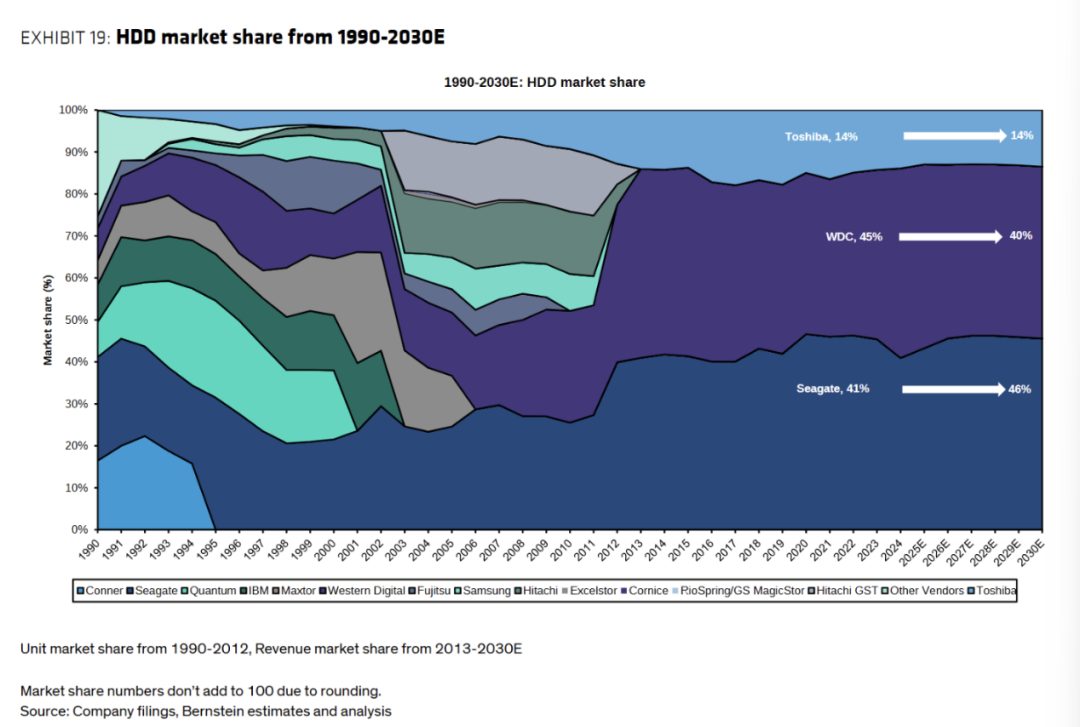
The industry underwent a decisive shakeout in 2011–2012: Seagate acquired Samsung's HDD business, and Western Digital acquired Hitachi GST. During the critical period of these mergers, catastrophic flooding hit Thailand in October 2011, where about 53% of global HDD capacity and key component factories were concentrated, leaving the entire industry reeling.
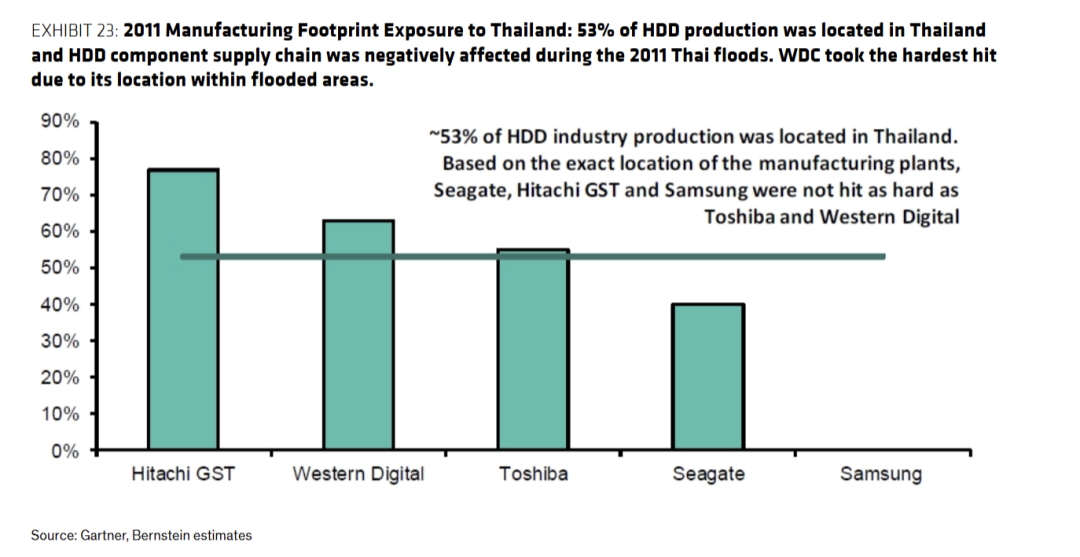
The flood had three profound impacts:
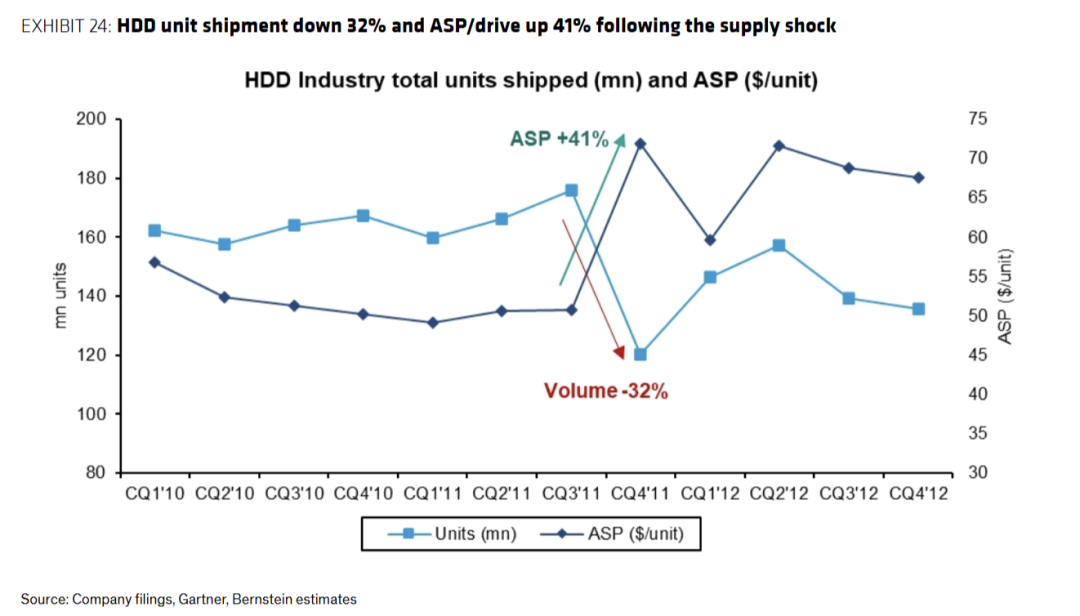
a. Short-term volume decline and price surge: In Q4 2011, industry shipments plummeted from 176 million units in Q3 to 120 million (-32%), causing a severe supply-demand imbalance and a roughly 41% year-over-year increase in the average selling price (ASP).
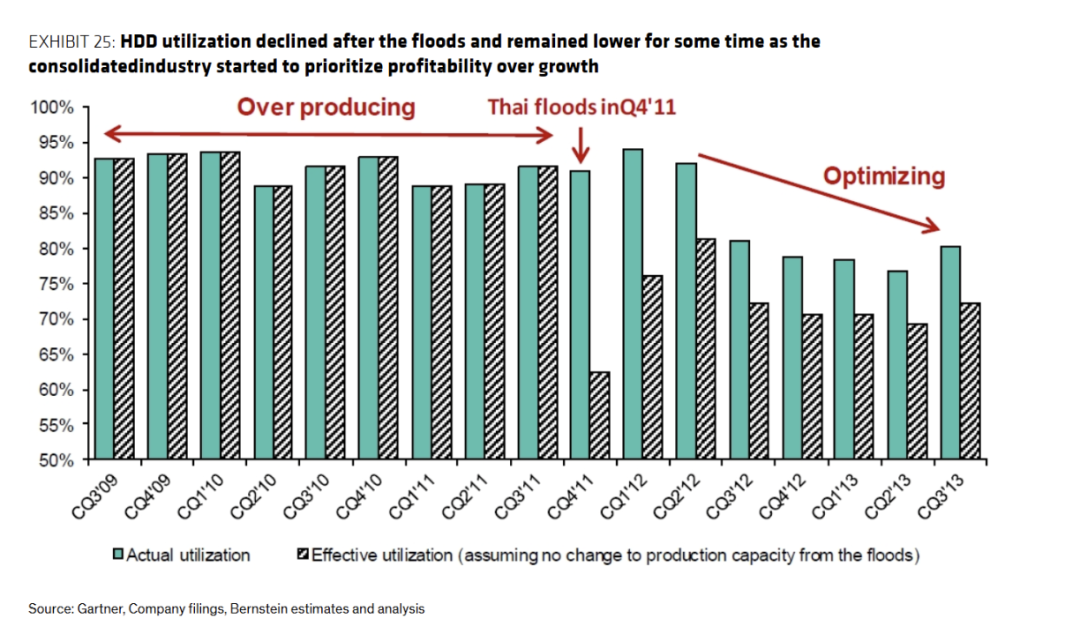
b. Demand never fully recovered: While manufacturers restored most capacity by Q2 2012, post-disaster high prices accelerated PC weakness and SSD substitution, with quarterly shipments never again reaching the peak of 176 million units and capacity utilization falling from about 90% pre-flood to 77%–81%.
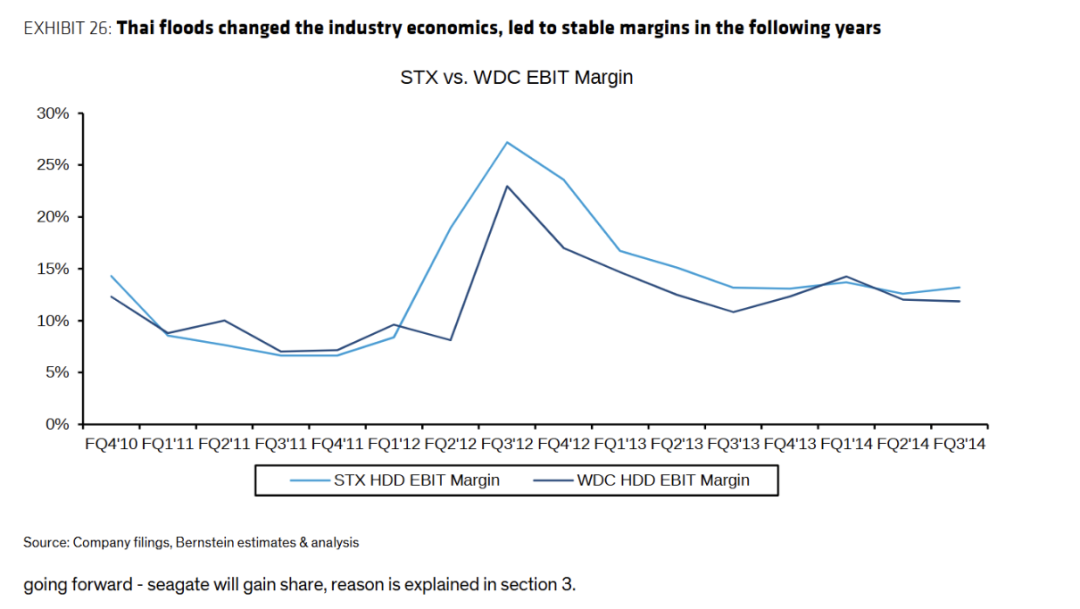
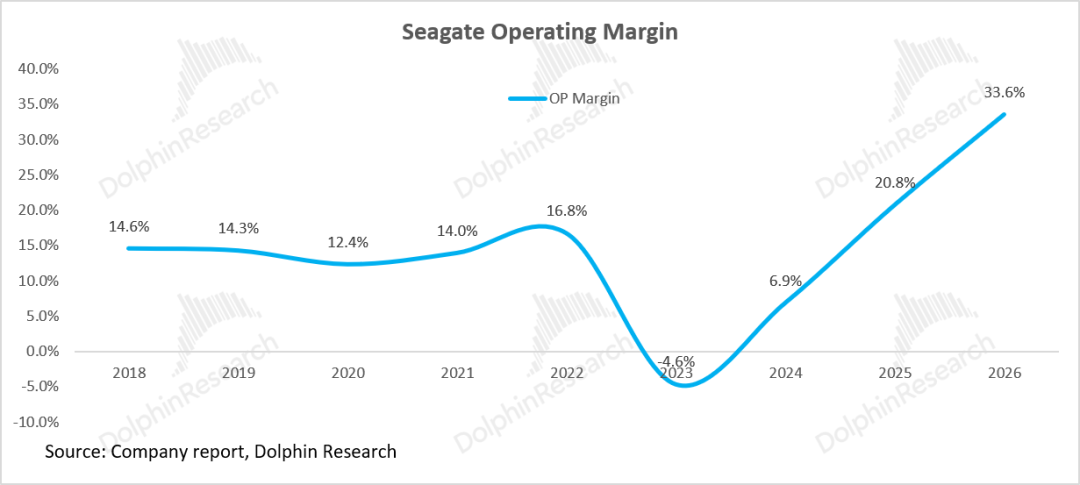
c. Profit margins rose: Before the flood, Seagate and Western Digital's HDD operating margins were only about 6%–7%; the shortage drove them to 27% and 23% in 2012, respectively, and they have since stabilized at 11%–16% (with a central tendency around 13%), nearly doubling from pre-flood levels.
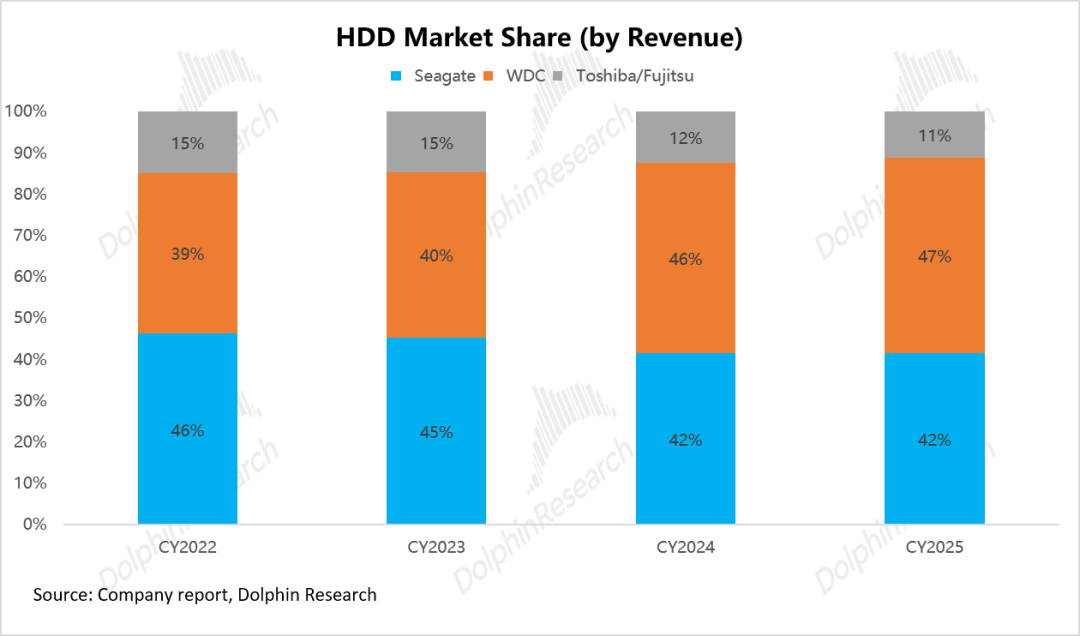
With the mergers completed, only Seagate, Western Digital, and Toshiba remained globally (with market shares by revenue of about 47%, 42%, and 11%, respectively, in 2025). After the flood, cloud giants like Microsoft, Google, and Amazon signed multi-year long-term agreements (LTAs) with Seagate and Western Digital to lock in capacity, shifting HDDs from a highly cyclical commodity to a more stable and predictable model.
More importantly, the flood and subsequent demand contraction led the surviving giants to adopt rational supply strategies: after merging, they did not resume price wars but instead embraced a shared discipline of 'prioritizing profits over market share,' which continues today.
III. Why is supply expansion difficult? Can Chinese capacity compete?
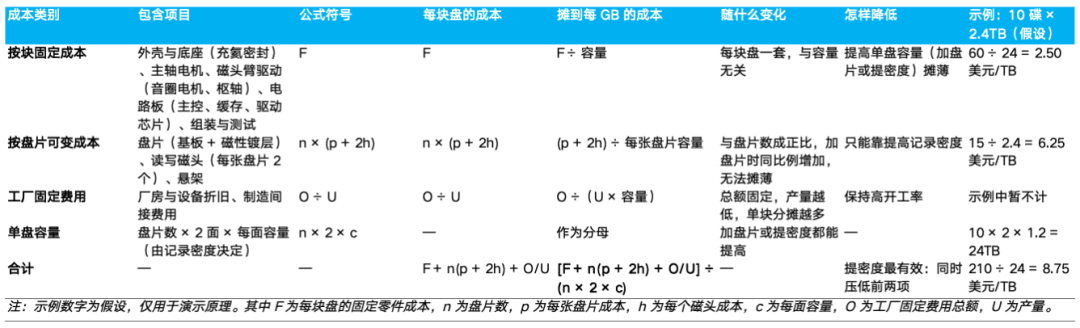
HDD shipment capacity = number of drives × capacity per drive, with capacity per drive depending on the number of platters and areal density (data stored per square inch of platter). Thus, manufacturers have only three ways to expand supply, each with vastly different costs:
a. Increase drive count: Build or restart production lines. Each drive requires a full set of motors, head arms, circuit boards, and casings, with little reduction in cost per TB.
b. Increase platter count: Fit more platters into the same-sized drive enclosure. However, each additional platter requires paying for an extra platter and two more heads—the most costly components in nearline drives—and the additional capacity gained from each extra platter diminishes marginally (only 10% when going from 10 to 11 platters).
c. Boost areal density: Keep components the same but store more data per platter, spreading all physical costs over more data—the most cost-effective approach. This explains why neither Seagate nor Western Digital has been willing to add new drive capacity in the current AI cycle.
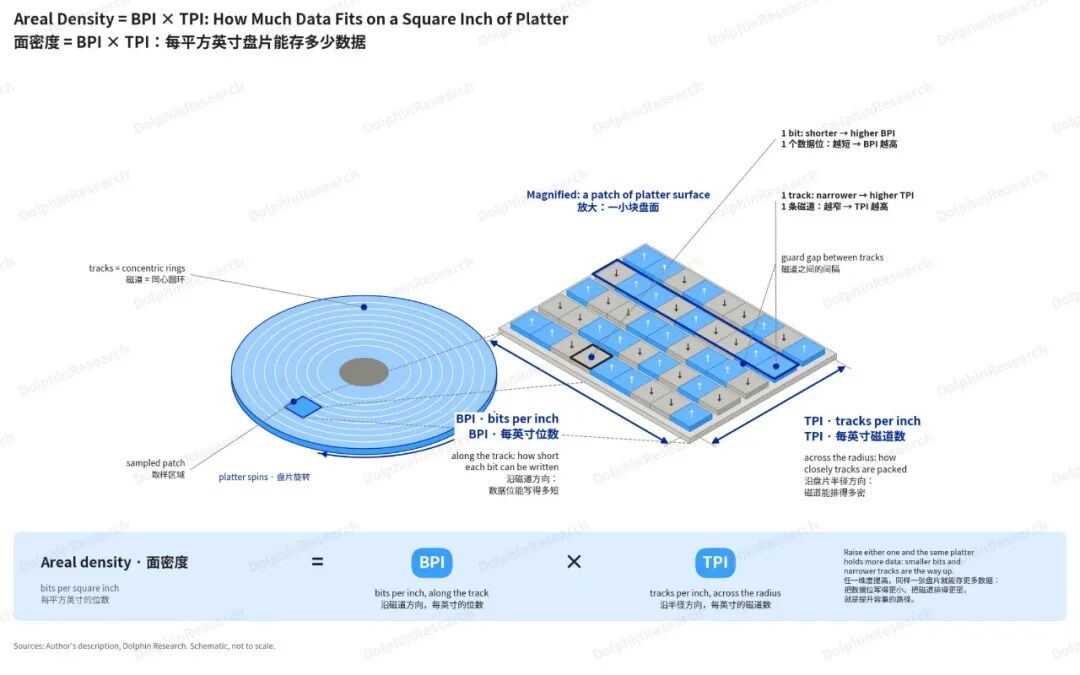
1. Technology: Areal density determines cost, with Seagate pulling ahead via HAMR
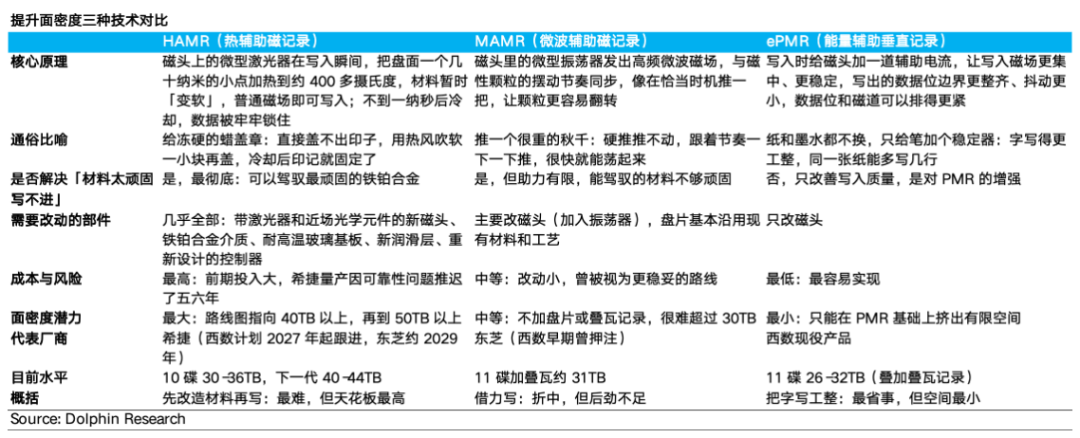
Traditional perpendicular magnetic recording (PMR) is nearing physical limits: smaller data bits are more prone to thermal-induced errors, and switching to more 'stubborn' magnetic materials makes them inaccessible to conventional heads. The industry has thus shifted to energy-assisted magnetic recording:
HAMR (Heat-Assisted Magnetic Recording): Uses a laser to heat the platter surface during writing, temporarily softening stubborn materials—like softening hard wax before stamping. It requires replacing nearly all core components, making it the most difficult but highest-potential approach, led by Seagate.
MAMR/ePMR: Uses microwaves or auxiliary currents to aid writing, with minor modifications and lower costs but limited improvements, led by Toshiba and Western Digital, respectively.
The three companies have thus diverged:
Seagate: Two decades of HAMR bets pay off later
HAMR required replacing substrates, media, heads, and controllers, with commercialization originally planned for 2018–2020 but delayed until 2024–2025 due to technical and reliability issues.
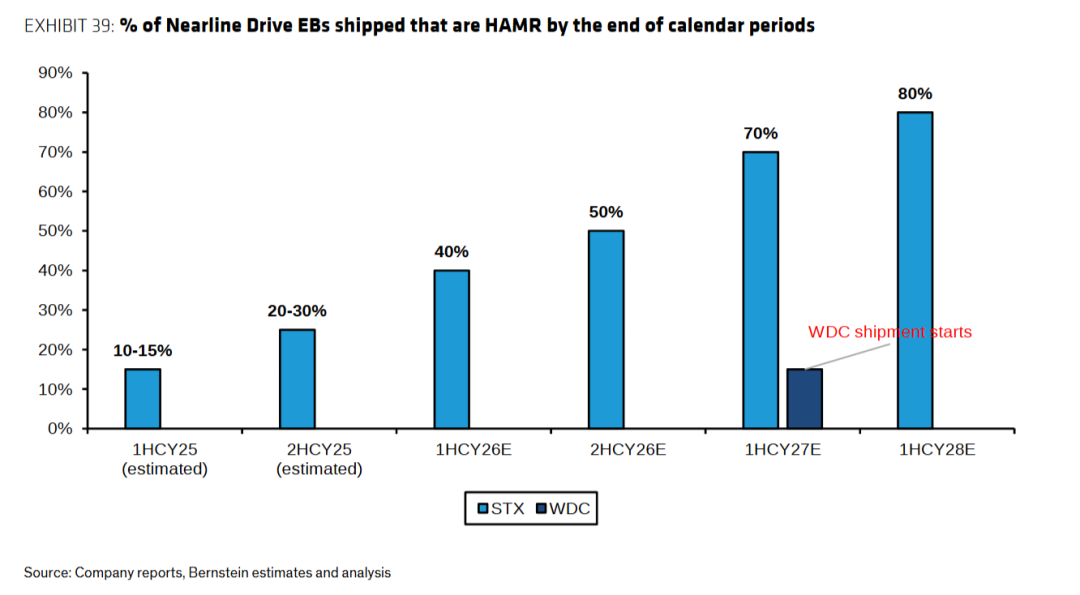
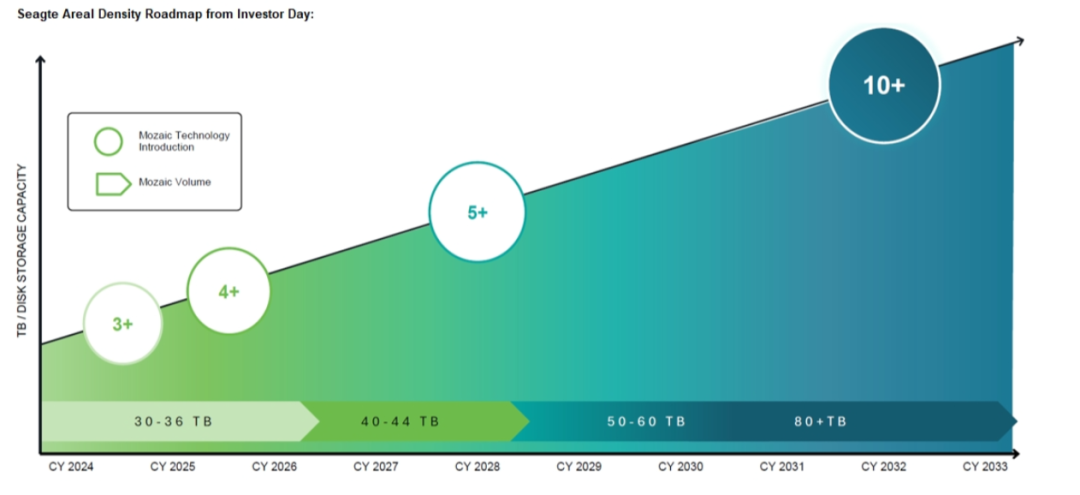
Persistence paid off: Mozaic 3+ (10 platters, ~30TB) has passed certification by major cloud providers and is ramping up volume; Mozaic 4+ achieves 44TB with essentially the same number of platters and heads, a ~47% increase over the previous generation, and future upgrades via areal density alone could push capacity beyond 50–60TB.
Western Digital: Relied on 'adding platters' before HAMR matured
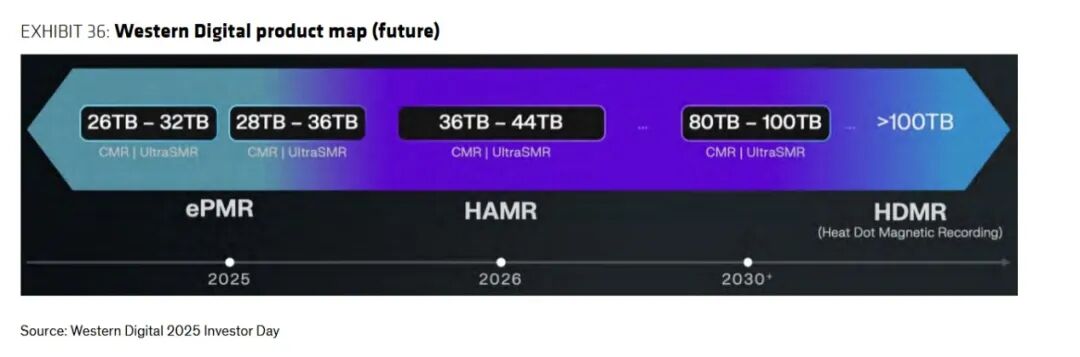
Initially cautious, Western Digital bet on MAMR and ePMR before deciding to shift to HAMR in 2023–2024.
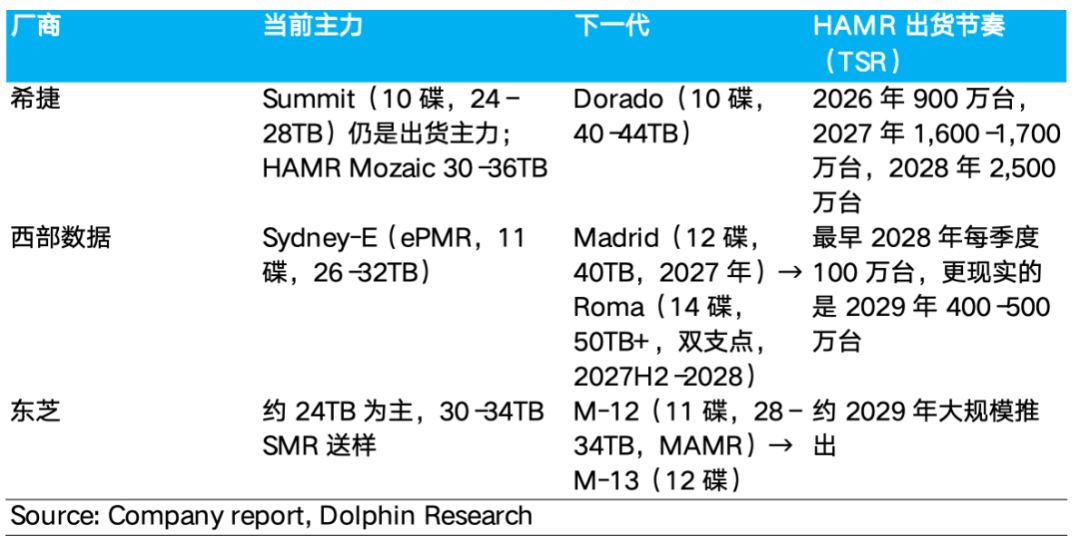
Until then, it could only expand capacity by 'adding platters': from 11 platters (26–32TB) to 12 (40TB) and then to 14 (50TB+). Western Digital claims to be about a year behind Seagate in HAMR, but TSR estimates it will not reach quarterly volumes of ~1 million units until 2028 at the earliest, implying an actual lag of about two years.
Toshiba: Sticking with MAMR, Struggling with Shingled and Multi-Platter Designs
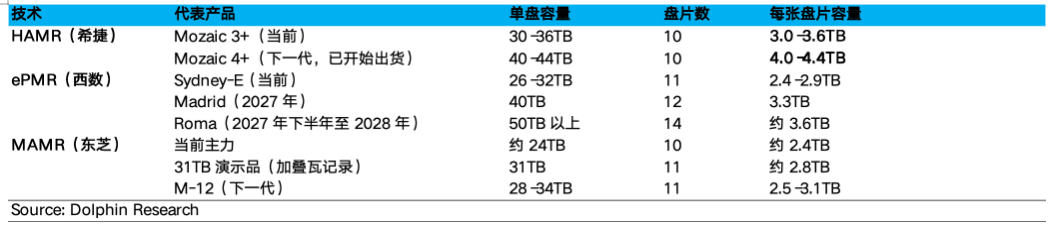
Toshiba's areal density significantly lags behind: In terms of capacity per platter, Seagate's HAMR currently offers about 3.0–3.6TB, with next-gen reaching 4.0–4.4TB; Western Digital's ePMR offers about 2.4–2.9TB, while Toshiba's MAMR offers only about 2.4TB, with its HAMR not set for full rollout until around 2029.
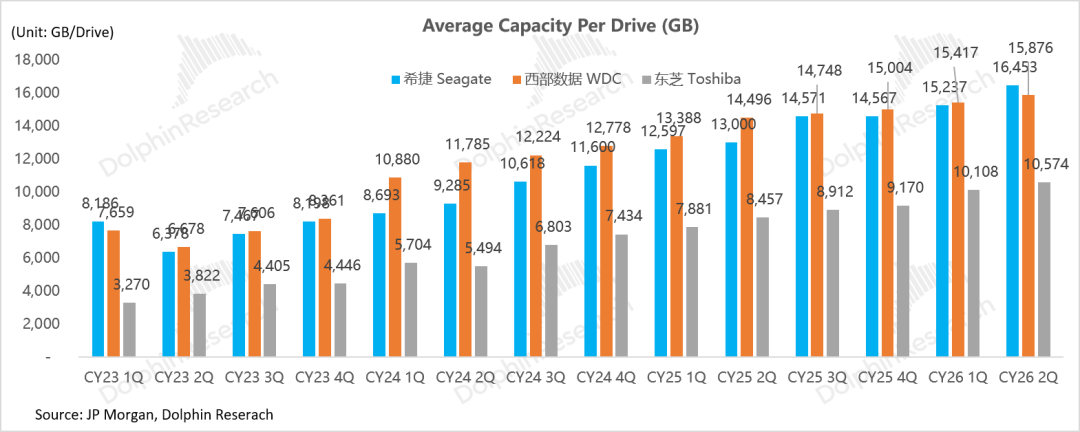
This gap is reflected in shipments: In Q2 2026, with HAMR scaling up, Seagate's average capacity per drive rose to 16.5TB (+27% YoY), surpassing Western Digital's 15.9TB (+10% YoY) for the first time, while Toshiba's stood at only about 10.6TB.
Summarizing the current technology paths of the three companies:
a. Seagate relies on 'increasing density': Locking in a 10-platter architecture and boosting capacity per platter with HAMR for the most thorough cost reduction;
b. Western Digital relies on 'adding platters': Before HAMR matures, it can only rely on 11–14 platters to meet capacity demands, leaving limited room for cost reduction;
c. Toshiba relies on 'adding platters + expanding production lines': Lagging in areal density across the board, it is forced to expand production to catch up on shipment capacity, resulting in the lowest capital efficiency.
Cost reduction is especially crucial for the HDD industry, a stark contrast to NAND:
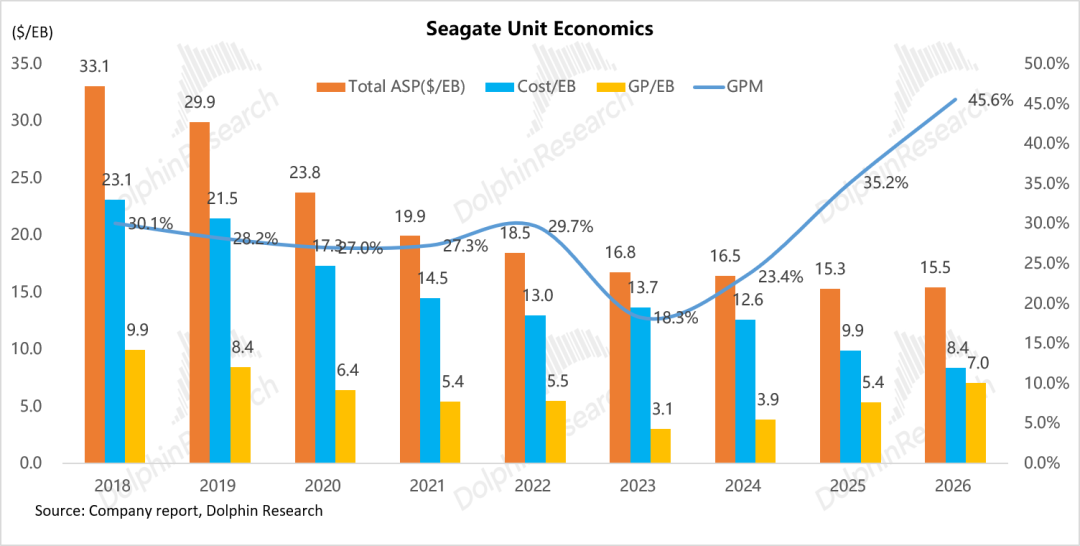
In FY26, SanDisk's gross margin surged from 30% to 72%, driven by a 139% YoY increase in unit price; Seagate's gross margin rose from 35% to 46%, with only a ~1% increase in unit price, relying instead on a ~15% YoY decline in cost per TB. Over FY23–FY26, Seagate's gross margin climbed from 18% to 46%, nearly entirely from cost reductions.
While HDD costs have also declined in the past, prices fell in tandem, passing the benefits to customers; this time, as prices rebound, cost reduction gains are staying more with manufacturers. Under the same pricing discipline, faster cost reduction means higher profits—this is the value of areal density leadership.
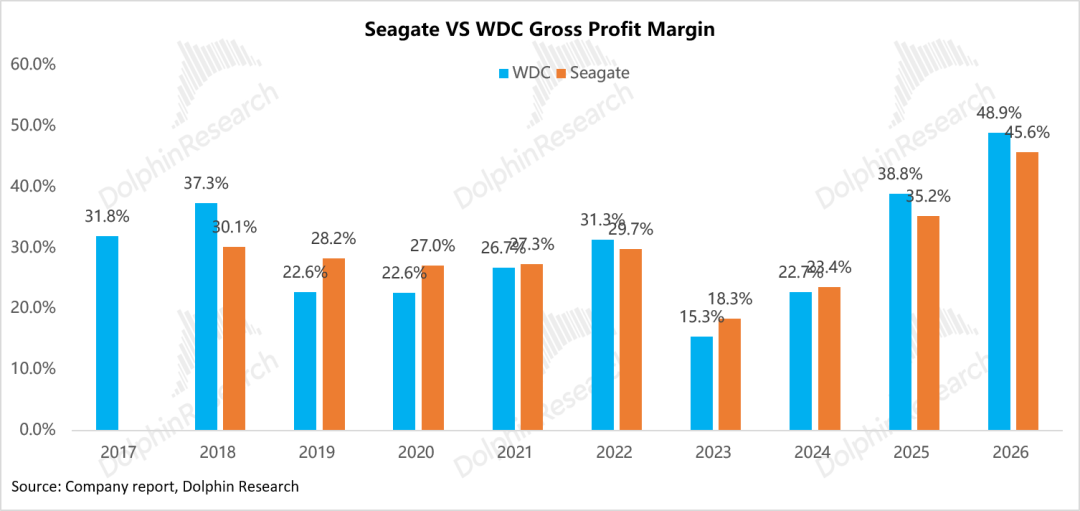
Currently, HAMR yields are still ramping up, with cost per GB roughly on par with ePMR, one reason Western Digital's gross margin temporarily edged above Seagate's in FY25–FY26.
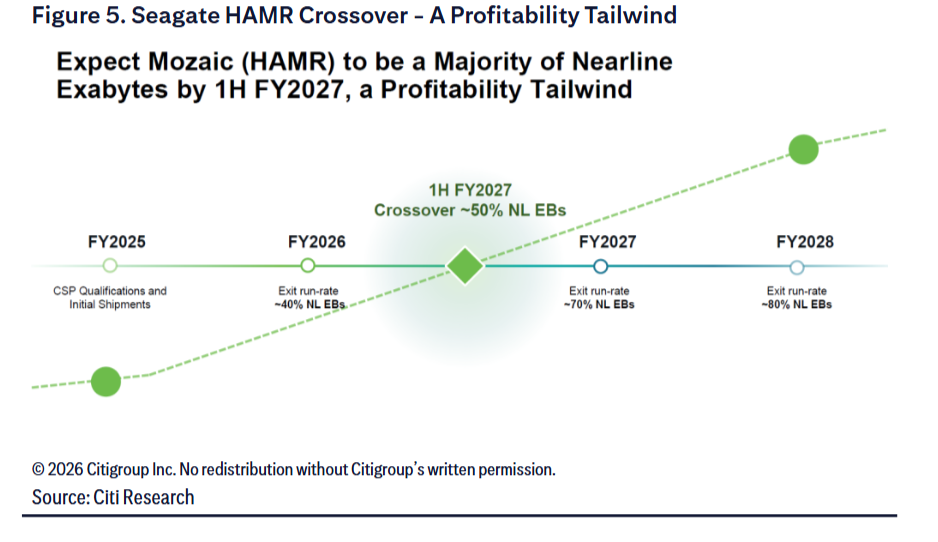
As HAMR scales up, this dynamic is expected to reverse: Seagate's share of HAMR in nearline shipment capacity will rise from 40% at the end of FY26 to 70% by the end of FY27, with products above 40TB also scaling up about a year earlier than Western Digital's.
2. Bottleneck: Money isn't the issue—components and time are
While HDDs are currently in short supply, scaling up production in the short term is difficult. According to MS estimates, by capacity, nearline HDD demand grows 40%–50% annually, while supply grows only 30%–35%, leaving a gap of about 300EB in 2026 (10%–15% shortage), widening to ~400EB in 2027–2028. Three barriers are holding back supply:
① Components: Insufficient in-house production, difficulties in outsourcing
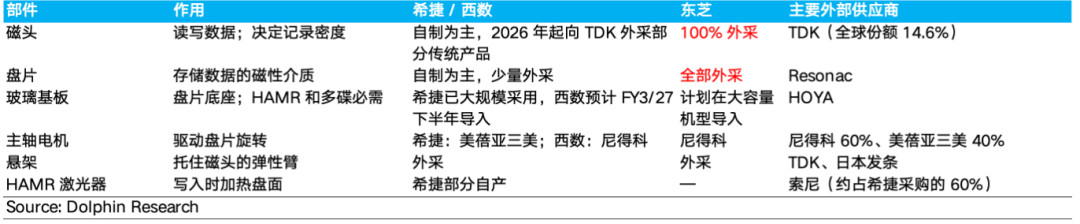
Seagate and Western Digital primarily manufacture their own heads and platters, but their in-house capacity was configured for a shrinking market over the past decade. This time, component demand is growing significantly faster than finished drives for two reasons:
Each drive uses more components: Nearline drives average ~20 heads per drive, far higher than the industry average of ~12.6; for Western Digital, each additional platter requires one more platter and two more heads.
Technology transitions consume in-house capacity: HAMR heads require integrated lasers, with yields still ramping up. Seagate prioritizes its in-house lines for HAMR, reducing traditional head output and necessitating some outsourcing.
Expanding head and platter production isn't easy, as their processes are closer to semiconductors and materials industries:
Heads: Read/write elements are fabricated on wafers via thin-film deposition and lithography, then diced and polished. Only Seagate, Western Digital, and TDK can do this, with each generation requiring redesign.
Platters: Multiple magnetic layers are sputtered onto substrates, with ~65% of key sputtering equipment sourced from Intevac (acquired by Seagate). HAMR glass substrates rely almost entirely on HOYA.
While upstream expansion has started, a significant time lag exists between announcement and effective supply:
TDK: Guides nearline head shipments to grow ~50% in the fiscal year ending March 2027, with outsourcing to Seagate and Western Digital ramping up since Q2 2026, but only to fill their in-house gaps, with 70%–90% of output going to Toshiba.
Resonac: Plans to boost platter capacity from ~160 million/year to ~230 million/year by 2029 (+44%); Singapore's new 50 million-unit capacity will come online from 2027, likely fully absorbed by Toshiba in advance, leaving little for Seagate and Western Digital.
HOYA glass substrates: A new ~¥50 billion Vietnam plant won't contribute capacity until around 2028.
A deeper issue is that component makers are hesitant to expand aggressively: Pricing power lies with drive makers, with head price increases limited to ~5%–10% and suspension arms—though scarce—not seeing significant price hikes. Component makers bear the investment risk of expansion without corresponding price rewards, having experienced a decade of HDD decline, and are naturally cautious.
Thus, Dolphin Research believes new component capacity that truly eases supply-demand tightness won't arrive until after 2028.
② Production lines and time: According to Seagate management, building a new factory from investment to stable mass production takes at least two years. The plant itself isn't slow to build; the delays come from factors outside the plant:
a. Heads, platters, and drive assembly all require cleanrooms, with sputtering, deposition, precision assembly, and testing relying on specialized equipment with few suppliers;
b. New lines require repeated tuning to stabilize yields; large-capacity drives need full-drive read/write testing before shipment, with testing time increasing with capacity, often becoming an invisible bottleneck. Additionally, HAMR technology transitions consume capacity, making just maintaining current shipment volumes challenging.
③ Technology and certification: Products must pass lengthy cloud vendor certifications after launch. Toshiba planned to launch products above 40TB in FY2025–26 but is still sampling at 30–34TB, showing that 'having production lines' doesn't equal 'having large-capacity supply.'
In contrast, capital is not a constraint: Toshiba can restart idle lines for ~$380 million, far below DRAM/NAND investments that often run into billions.
3. Willingness: Seagate and Western Digital don't want to expand—only Toshiba does
Both Seagate and Western Digital have explicitly ruled out adding unit capacity: Seagate says its factories are at full capacity and it won't build new ones, relying on HAMR to grow nearline shipment capacity by ~25% annually; Western Digital similarly avoids chasing share, steering customers toward higher-capacity drives. Both keep capital expenditures at just 4%–6% of revenue for three reasons:
a. Building more drives isn't cost-effective: Unit expansion doesn't reduce costs and may depress prices; increasing density is the true path to cost reduction.
b. Price hikes are more profitable than volume growth: Both say price increases drive ~90% incremental gross margin. Long-term agreement (LTA) prices for major customers are ~$15/TB, with negotiation targets of $25–30/TB for 2027–2028; non-LTA prices already reach $30–50/TB.
Currently, ~70%–80% of capacity is locked into LTAs with large cloud vendors, with the rest sold at a premium and prices locked for only 12 months to retain pricing power amid shortages.
c. Historical lessons: Memories of post-flood overcapacity linger, and the discipline of 'prioritizing profit over share' has doubled both companies' profit margins, with no reason to break it voluntarily.
The sole exception is Toshiba: On October 2, 2026, Toshiba announced plans to nearly double data center HDD capacity (by capacity) by the end of FY2027 (March 2028) versus FY2025; according to Nikkei, it will invest ~¥60 billion (~$380 million) with a medium-term share target of 30%.
Toshiba's intent is clear: As a pure assembly model (relying on TDK for heads, Resonac for platters, and HOYA for glass substrates), its 2025 HDD revenue of ~$2.5 billion is only ~1/4 of Seagate's or Western Digital's. Unable to catch up in areal density, expansion is its most beneficial and least costly option. However, this investment mainly restarts idle equipment and addresses testing bottlenecks, with limited impact:
Insufficient to fill supply gaps: Even if Toshiba doubles nearline capacity, new supply over two years will be under 150EB, a drop in the bucket compared to the 300–400EB industry gap; even with Toshiba doubling and Seagate/Western Digital growing 25% each, Toshiba's share would only rise from 11.2% to 16.8%, with industry supply growth reaching ~33%, still below demand growth.
Product lag: Current data center drives are mainly 26/28TB, one to two generations behind U.S. firms, failing to meet cloud vendors' preference for 'higher capacity, fewer drives.'
Execution doubts: Toshiba set a 25% share target in 2022, only to see its share drop from 17% to ~11%.
Thus, Toshiba's expansion will have limited short-term impact on supply, demand, or prices, but it signals the first crack in oligopoly discipline. After 2028, when component expansion lands, Western Digital and Toshiba scale HAMR, and demand growth slows, supply-demand balance will truly test oligopoly discipline.
4. China's capacity: Unlikely to compete in finished drives soon
China plays more of a manufacturing base and materials (e.g., rare earth magnets) supplier role in the HDD chain, with no local firm able to compete with the Big Three in finished drives. Attempts by Great Wall/Excelstor, Nanhaitong, and others relied on imported lines and technology licenses, ultimately exiting due to quality, patent, or funding issues. Three barriers explain the lack of breakthrough:
① Barriers lie in heads and media, not assembly: Areal density depends on head, media, substrate materials and processes, plus decades of accumulated patents. Even Western Digital lags Seagate by ~2 years in HAMR mass production, making it even harder for latecomers.
② Closed supply chain: Heads, platters, substrates, and sputtering equipment are concentrated among a few U.S./Japanese firms, with capacity locked in by existing customers. Sputtering equipment leader Intevac has been acquired by Seagate, leaving new entrants struggling to secure components amid shortages.
③ Small market, strict certifications, and low ROI: Global HDD revenue was just ~$22.3 billion in 2025, divided among three firms; nearline drive customers are cloud vendors requiring long-term reliability certifications.
Unlike NAND, HDDs lack a mature third-party market for key equipment and materials, making it impossible to catch up by buying equipment and scaling up—hence Yangtze Memory's success in NAND but no 'HDD equivalent.'
Localization is starting: China's Vanguard Group plans a ¥10 billion ($1.4 billion) mechanical hard drive chain project in Guangzhou Nansha from October 2026 to September 2028, producing glass substrates and laser read/write components; startups have also shown prototype drives. However, these remain at the component or prototype stage and are unlikely to affect global supply in this cycle.
China's more realistic impact is indirect: If Yangtze Memory and others scale NAND production, driving down prices, the price gap between SSDs and HDDs will narrow. However, for the gap to shrink from ~20x (30TB enterprise drives, 2026 peak) to 2–3x remains far off.
IV. Why HDDs, written off by many, became the 'data destination' of the AI era?
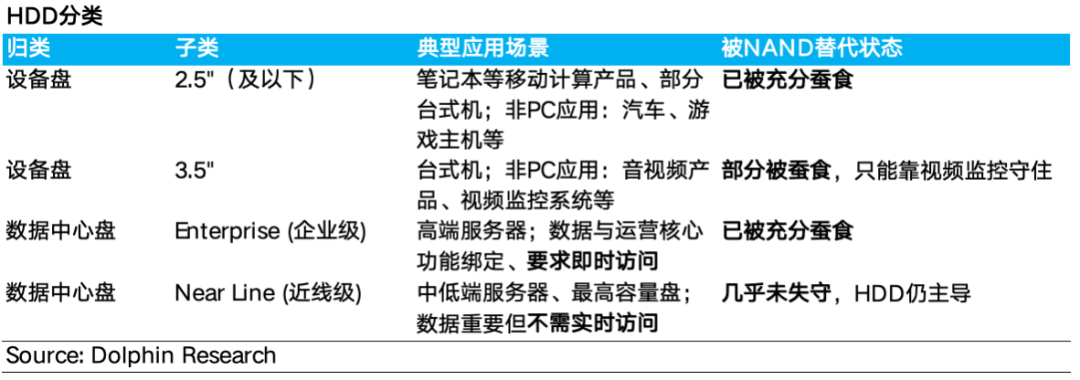
The HDD market broadly falls into four categories: 2.5" device drives (laptops), 3.5" device drives (desktops and video surveillance), enterprise drives (high-end servers), and nearline drives—the highest-capacity 3.5" drives storing massive 'warm/cold' data in data centers. The first three have been largely replaced by SSDs, with nearline drives still absolutely dominated by HDDs.
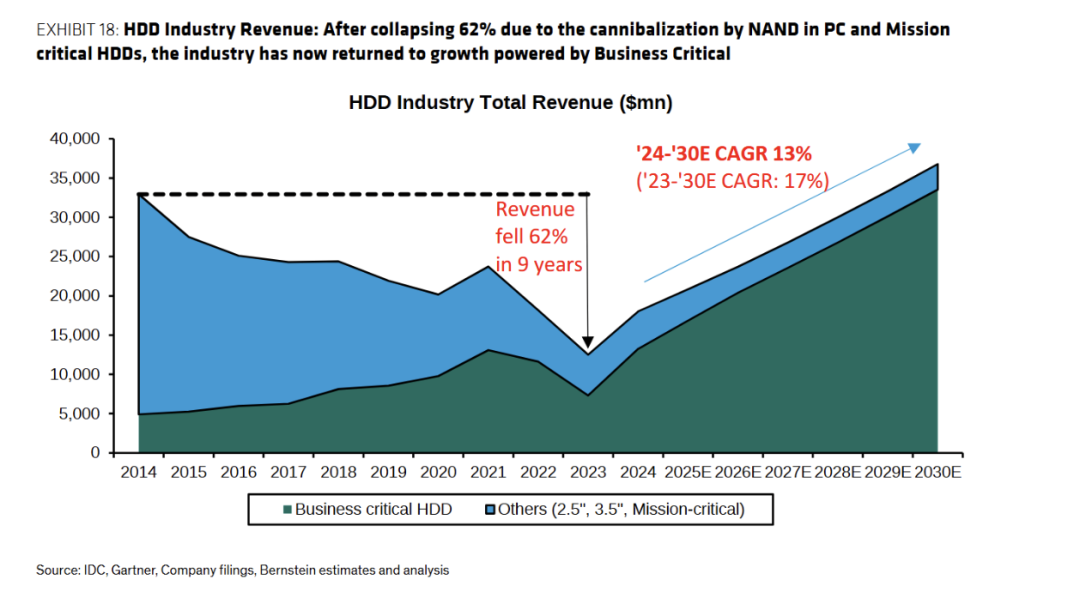
Over the past decade, HDD demand has undergone dramatic restructuring: From 2014–2023, as PC and enterprise drives were replaced, industry revenue plummeted 62%, from $33 billion to $12.5 billion; from 2023–2025, it rebounded 78% to $22.3 billion, with all growth coming from nearline drives, whose revenue share rose from 63% to a record 86%.
This means the period of most intense NAND erosion has passed. HDDs have shed their most vulnerable segments and are emerging as a beneficiary of AI-driven data explosion.
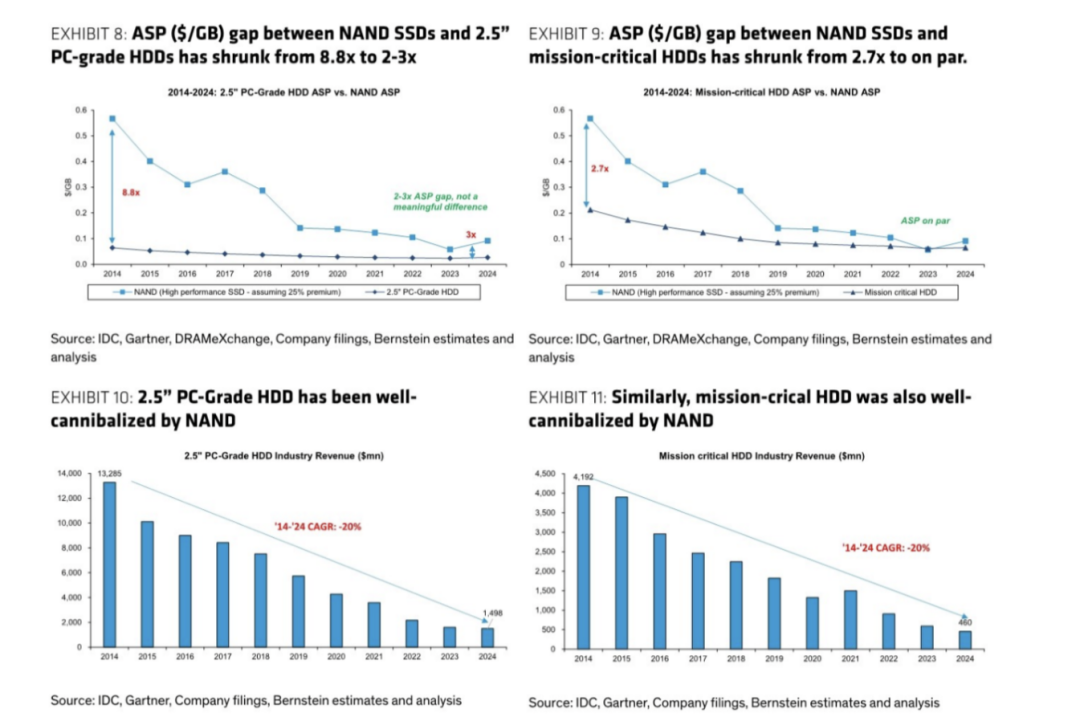
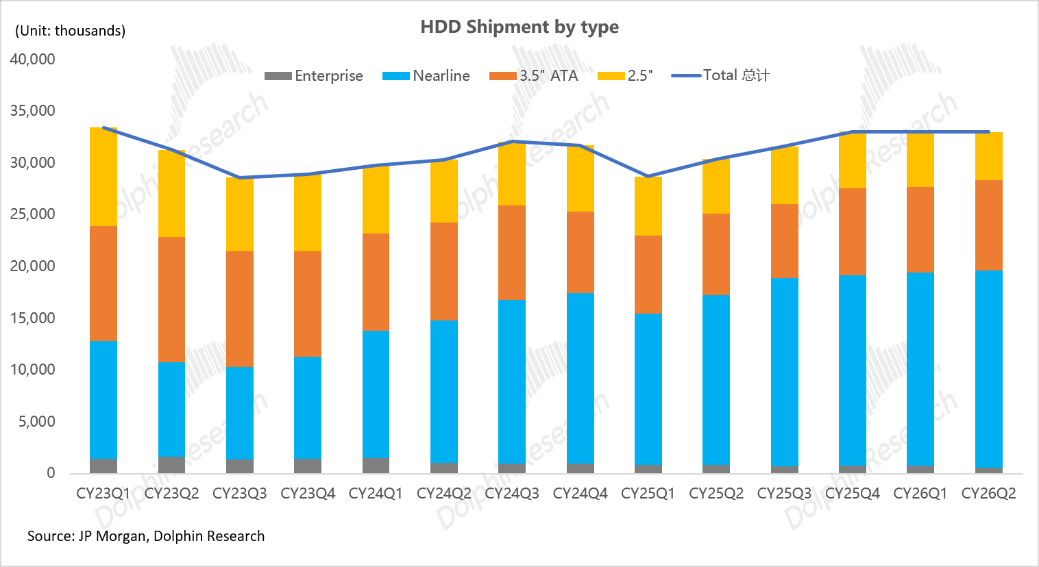
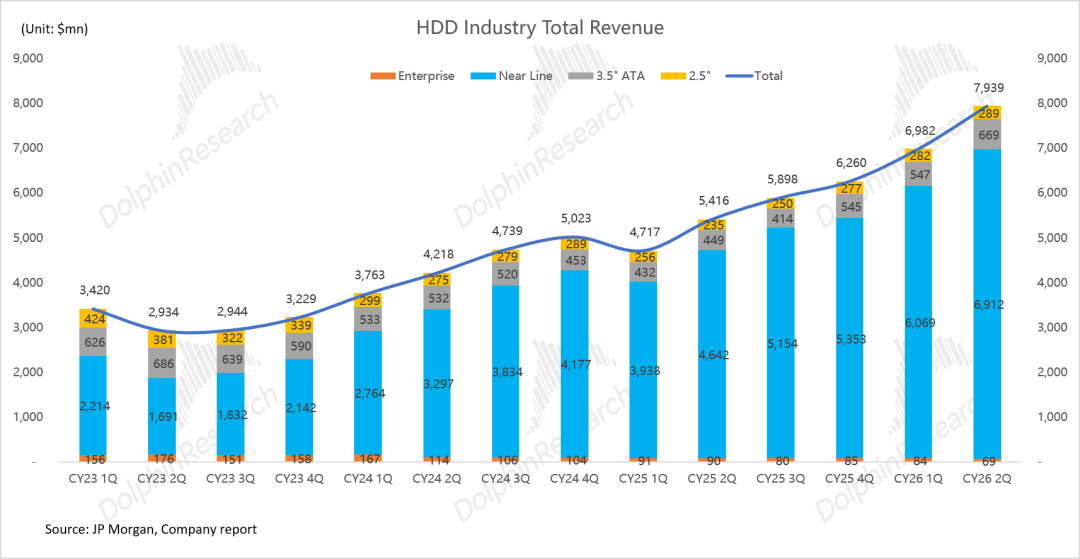
Why have some scenarios been completely transformed, yet nearline HDDs remain unshaken?
The key lies in the sensitivity of the scenario to performance and the price difference per GB between NAND and HDD: Considering the hidden advantages of SSDs in power consumption and space, when the price difference drops to within 2-3 times, replacement enters the "transition zone."
2.5" device drives: Laptops require thinness, power efficiency, and shock resistance. After the price difference narrowed to within 2-3 times in 2019, the HDD defense line collapsed, with revenue falling from $13.3 billion in 2014 to less than $1 billion by 2025.
Enterprise drives: Core databases and high-frequency trading are extremely sensitive to latency, making replacement irreversible: HDD revenue dropped from $4.2 billion in 2014 to $350 million in 2025, with SSDs now holding over 90% market share.
3.5" device drives: Desktops have shifted to flash memory, while video surveillance retains HDDs for their large data volumes, cost sensitivity, and sequential write-heavy workloads.
Why did replacement stop at nearline drives?
Even in 2023, when NAND prices were at their lowest, the price difference only dropped to about 4.8 times, never entering the transition zone. With NAND prices surging in 2024-2026, the price difference skyrocketed from about 5 times to around 20 times within two years, making "SSD replacement of HDD" economically meaningless.
The sharp price increase also prompted AI data centers to reevaluate storage architectures, with some demand potentially shifting back to HDDs. Some large cloud providers previously used enterprise SSDs as temporary replacements for HDDs during shortages, but this was only a stopgap measure, not an architectural migration.
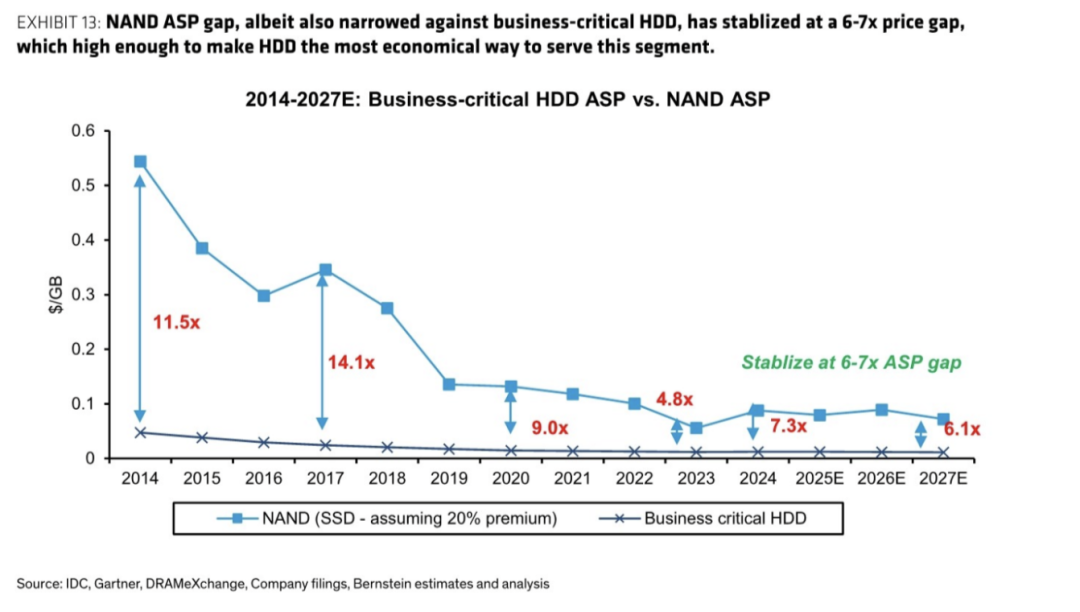
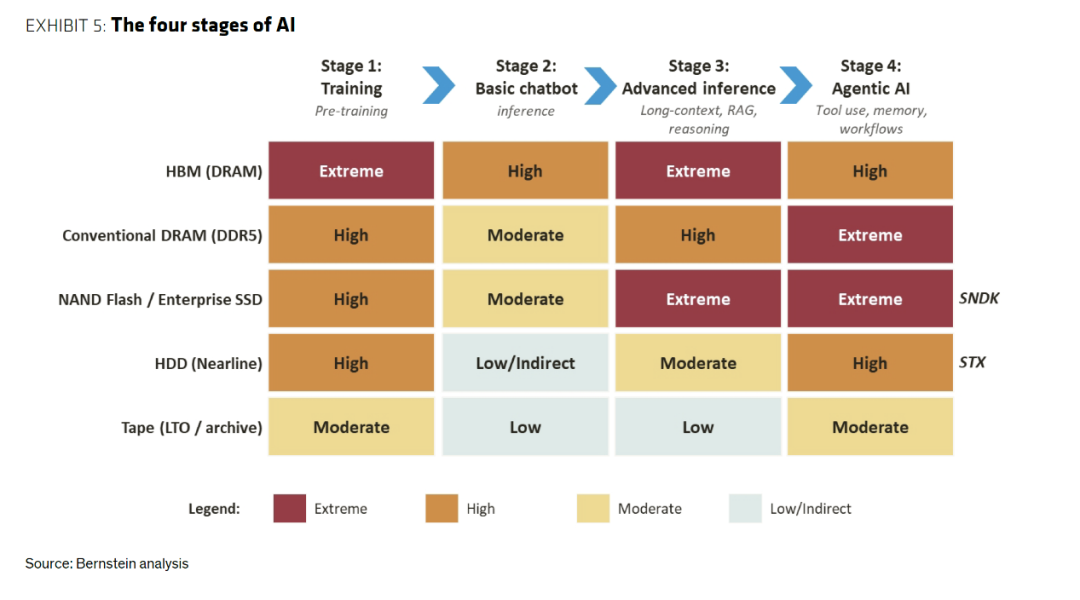
In AI data centers, if HBM and local SSDs are the "frontlines" of computing, then the data lake formed by nearline HDDs and QLC SSDs is the "distant central warehouse."
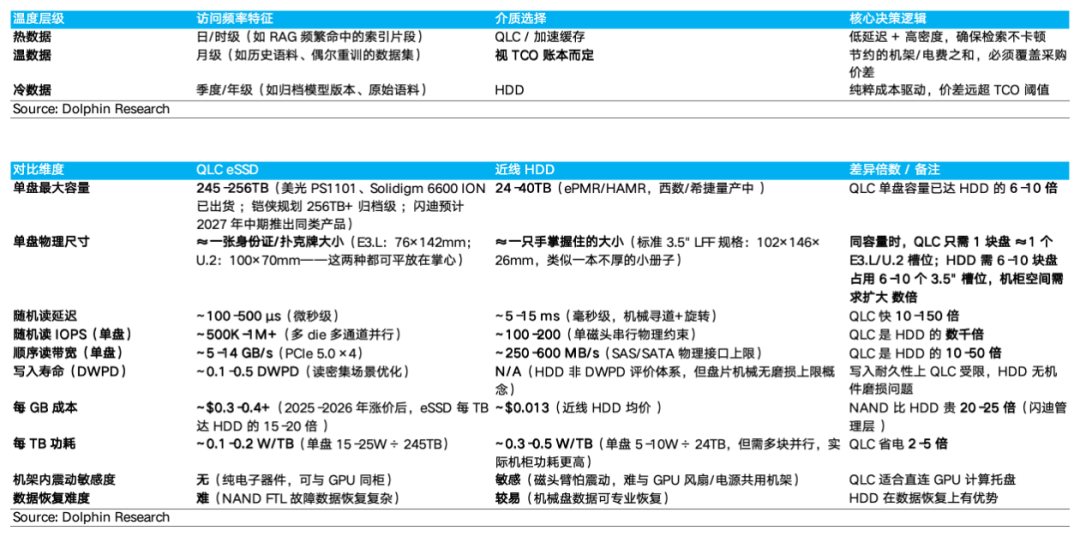
Among them, QLC SSDs store warm data that is still occasionally accessed, offering fast retrieval but higher cost per TB. HDDs serve as the large warehouse, primarily storing three types of data:
a. Model assets: Historical training checkpoints, older model versions, etc., rarely modified but extremely large and critical to retain.
b. Corpora and historical archives: Massive raw corpora and long-idle historical conversations; frequently accessed KV caches and vector indexes remain in memory and SSDs.
c. Operational "ledgers": System logs, evaluation records, historical prompts, etc., mostly requiring long-term retention for compliance, review, and retraining.
These three types of data are placed on HDDs for three reasons:
a. Access pattern alignment: These data are almost always "written in full, stored long-term, and occasionally read back in batches," which aligns perfectly with HDD sequential read/write speeds (250-300MB/s). SSD microsecond-level response times are unnecessary here.
b. Cost: In 2026, SSDs cost about 20 times more per GB than HDDs, with HDDs accounting for about 80% of cloud storage capacity. Replacing all HDDs with SSDs would entail astronomical capital expenditures.
c. Endurance: High-capacity QLC SSDs typically have only hundreds to thousands of write cycles, while HDDs have no write endurance issues, making them ideal for continuous log writing.
Summary
HDDs, a more "sunset" and marginal storage category than NAND, have managed to stage a comeback in the AI era thanks to the following five factors:
① Consolidated market structure, controllable supply
After mergers, acquisitions, and the Thailand floods, only three HDD manufacturers remain, with Seagate and Western Digital accounting for about 90% of revenue combined. Capacity expansion relies primarily on increasing areal density rather than building new production lines, fostering a tacit agreement among the three to prioritize profits over market share and retain cost-reduction benefits.
② Cheap, high-capacity, and durable, but slow
HDDs cost about 1/20th as much per GB as enterprise SSDs, with single-drive capacities exceeding 40TB and no write endurance issues, albeit with millisecond-level latency. They have retreated to the warm/cold data tier, becoming the "final destination" for AI data.
③ Limited capacity expansion, with only Toshiba willing to expand
Component shortages, lengthy factory construction, and HAMR migration timelines make significant supply increases unlikely before 2028. Seagate and Western Digital prefer price hikes over expansion, while Toshiba, the sole expander, cannot fill the 300-400EB gap. China, constrained by technology, patents, and a closed supply chain, cannot compete in finished drives this cycle.
④ Technological differentiation, wider performance gaps than NAND
Seagate leads in areal density by about 20-30% per platter with HAMR, Western Digital lags by about two years, and Toshiba trails further. Areal density leadership directly translates to cost-per-TB advantages and wider gross margins.
⑤ Replacement threshold: 2-3x price difference
The price difference for nearline drives only narrowed to about 4.8x and never entered the transition zone. After NAND price hikes, the gap widened to about 20x, halting replacements and even causing some demand to shift back to HDDs.
Thus, HDDs' reversal is not merely a cyclical rebound: On the supply side, oligopolies meet demand through areal density gains rather than expansion. On the demand side, AI makes data "accumulate without deletion," while NAND price hikes further solidify HDDs' cost advantage. The key factors to monitor are component capacity releases after 2028 and Toshiba's expansion pace.
In the next installment, Dolphin Research will focus on: Why do HDD and NAND cycles differ so sharply? How long can HDD price hikes last? Do Seagate and Western Digital have further upside? Stay tuned!
- END -
// Reprint Authorization
This article is an original work by Dolphin Research. Reproduction requires authorization.
// Disclaimer and General Disclosure
This report is for general comprehensive data purposes only, intended for users of Dolphin Research and its affiliates for general reading and data reference. It does not consider the specific investment objectives, product preferences, risk tolerance, financial status, or special needs of any recipient. Investors must consult independent professional advisors before making investment decisions based on this report. Any investment decisions made using or referencing the content or information in this report are at the investor's own risk. Dolphin Research shall not be liable for any direct or indirect responsibilities or losses arising from the use of the data contained herein. The information and data in this report are based on publicly available sources and are for reference purposes only. Dolphin Research strives to ensure but does not guarantee the reliability, accuracy, or completeness of the information and data.
The information or viewpoints mentioned in this report shall not, under any jurisdiction, be construed or deemed as an offer to sell securities or an invitation to buy or sell securities, nor shall they constitute recommendations, solicitations, or endorsements of securities or related financial instruments. The information, tools, and data in this report are not intended for distribution to or use in jurisdictions where such distribution, publication, provision, or use would contravene applicable laws or regulations or require Dolphin Research and/or its affiliates or subsidiaries to comply with registration or licensing requirements in those jurisdictions, nor to citizens or residents of such jurisdictions.
This report reflects only the personal viewpoints, insights, and analytical methods of the relevant contributors and does not represent the stance of Dolphin Research and/or its affiliates.
This report is produced by Dolphin Research, with copyright owned solely by Dolphin Research. No institution or individual may, without prior written consent from Dolphin Research, (i) produce, copy, duplicate, reproduce, forward, or create any form of copies or reproductions in any manner, and/or (ii) directly or indirectly redistribute or transfer to other unauthorized persons. Dolphin Research reserves all relevant rights.
-
![]()
"The New Generation of PayPal Mafia"? Young Chinese Are Seizing Silicon Valley
-
![]()
Can SAIC Audi, a Brand Yet to Excel in Gasoline Cars, Find Success in the New Energy Vehicle Market?
-
![]()
Why Has the Underestimated HDD Become the 'Data Terminal' for AI?
-
![]()
Survey | With Shanghai Factory Nearing Completion, Lexus Embarks on Electric Redemption
-
![]()
The Largest IPO Ever: Anthropic’s Prospectus Reveals a Valuation Nearing $2 Trillion, Blending Cutting-Edge Tech with Business Strategy
-
![]()
The Spectacle of the Flying Car Can't Rescue Tesla's Core Operations
-
![]()
Seagull vs. Starwish: A Clash of Titans in the Electric Compact Car Market
-
Capital Reevaluation of the 'Battery King'