Nebius: The New Cloud Sector's "Magic Pill"—Solid Gold or Just a Bubble?
 11/03 2026
 530
Previously, Dolphin Guy covered Oracle and CoreWeave (CRWV) in turn—two "giants" among the new cloud players. This time, the spotlight shifts to the "magic pill" meme stock of the new cloud sector: Nebius (NBIS).
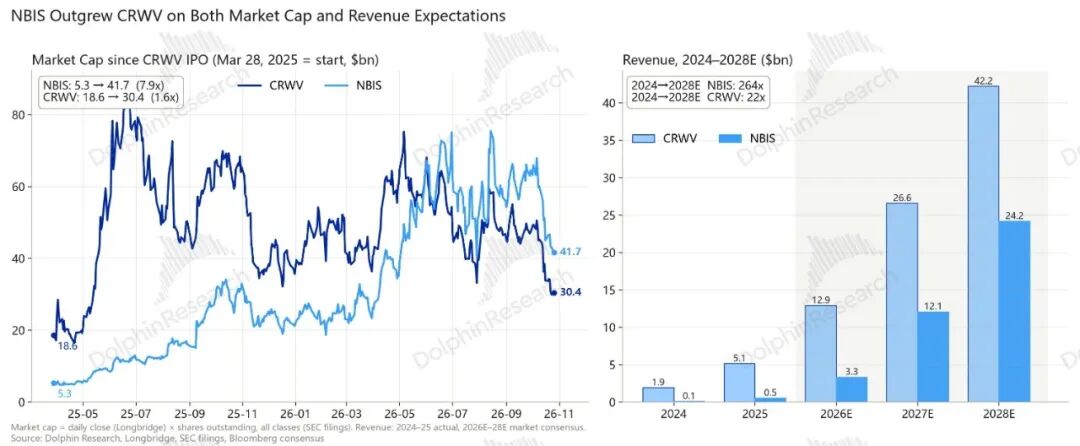
In terms of scale, NBIS is a "small fry": its 2024 revenue was only about $90 million (excluding the spun-off Toloka), less than 1/20 of CRWV's; even by 2027 projected revenue, NBIS would still be less than half of CRWV's.
In terms of market cap, however, NBIS has pulled ahead from behind: when CRWV listed in March 2025, NBIS was less than 1/3 of it, and by early June was at one point left at less than 1/8; just one year later, NBIS completed the reversal in June 2026, and now (October 26 close) at about $42 billion, it is nearly 40% higher than CRWV.
In valuation, the contrast is even more striking: NBIS's market cap is about 3.5 times its 2027 projected revenue, while CRWV's is only 1.1 times. For the same dollar of revenue, the market is willing to give NBIS about 3 times the valuation.
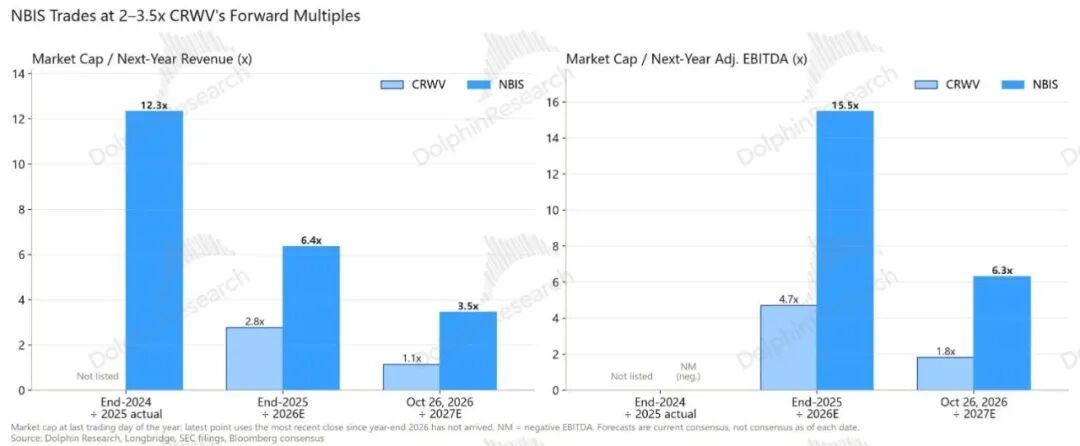
With smaller revenue and lower profit margins but a notably higher valuation, what exactly is the market paying for in NBIS? This article breaks it down item by item:
1) How do the founding teams, development histories, and ties to Nvidia differ between the two?
2) Although both are Neo Clouds, are their business models, growth prospects, and certainty the same?
3) At first glance CRWV has higher profit margins, so why does NBIS instead command a valuation premium?
4) Compute power and Capex: who expands faster? Who has secured data centers and power?
5) The foundation of everything: whose financing structure, financing capability, and balance sheet are better?
6) How much is NBIS really worth?
The following is a detailed analysis
I. Very different origins, so why do they increasingly resemble each other?
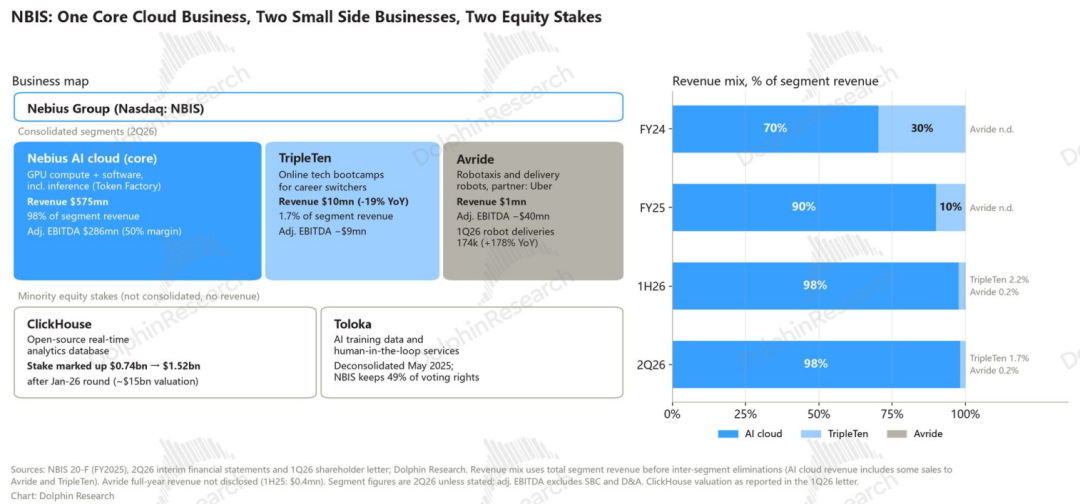
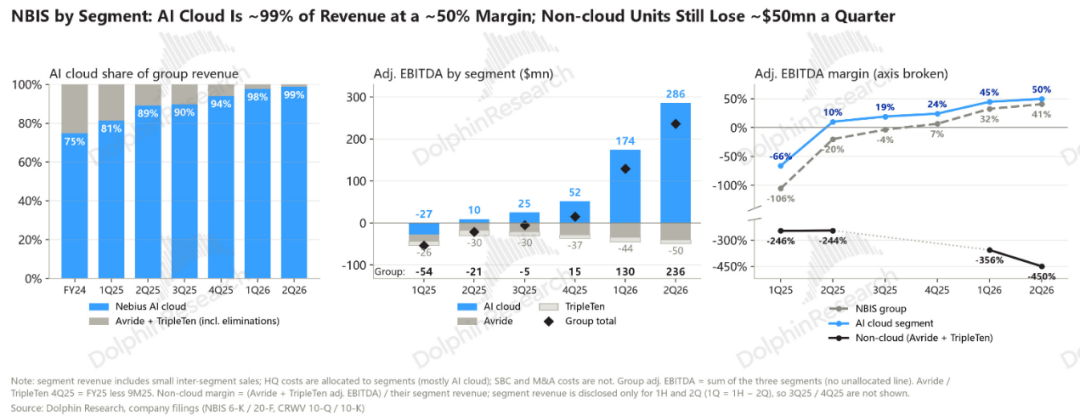
NBIS's business can be summarized as "one main business, two side businesses, two equity stakes." The main business is AI cloud (Nebius AI Cloud): renting out GPU compute power, along with software such as the inference platform Token Factory. 2Q26 AI cloud revenue was $575 million, contributing 98% of total revenue and all of the profit.
The two side businesses are the autonomous driving business Avride and the online vocational training business TripleTen, both still losing money: a. Avride includes autonomous vehicles and sidewalk delivery robots, mainly deployed through cooperation with Uber. Business volume is growing rapidly, but quarterly revenue is only about $1 million, and 2Q26 adjusted EBITDA loss was about $40 million.
b. TripleTen is online vocational skills training for adults who want to switch into tech roles, and recently has also been adding more AI content. Its 2Q26 revenue was $10 million, with a loss of about $9 million.
In addition, NBIS also holds minority stakes in two other businesses—the open-source real-time analytics database ClickHouse and the AI training data company Toloka. Both have been spun off and are no longer consolidated, affecting net profit only through investment income.
In terms of revenue structure, non-cloud businesses still accounted for about 30% of total revenue in 2024. But as AI cloud rapidly scaled, its revenue share rose to about 90% starting in 2Q25, and by 2Q26 had reached 98%. NBIS is now essentially a "pure" cloud company.
1.1 Management: different origins, same result
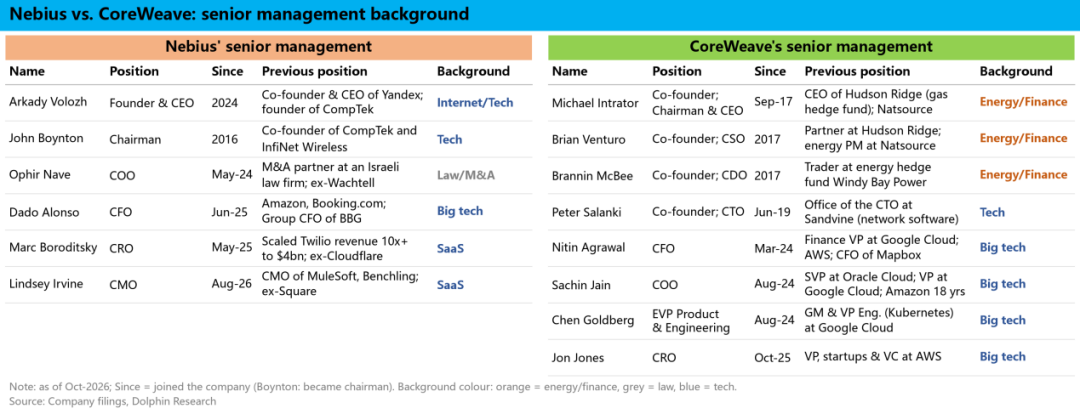
Conclusion first: the starting points of the two are almost opposite, but after listing each filled in its shortcomings, and the expansion paths and management configurations have largely converged. Company and management backgrounds are not an important reason for the valuation difference between the two.
In terms of starting point, CRWV was founded by three energy traders and started out in mining, excelling at securing power and finding financing—"business first, capabilities later";
NBIS emerged from the Russian tech giant Yandex. CEO Volozh is a co-founder of Yandex, restarting with over a thousand engineers and an entire cloud technology stack—"capabilities first, business later."
In terms of expansion path, NBIS is basically replicating CRWV: win anchor mega-deals from hyperscalers → bring in a hyperscaler-veteran CFO → use contracts to leverage financing → bind with Nvidia → lock in GW-level power. And the time gap is rapidly shrinking: it was about 26 months later in winning the Microsoft mega-deal, but by the Meta mega-deal and Nvidia equity investment the gap was only about a month and a half.
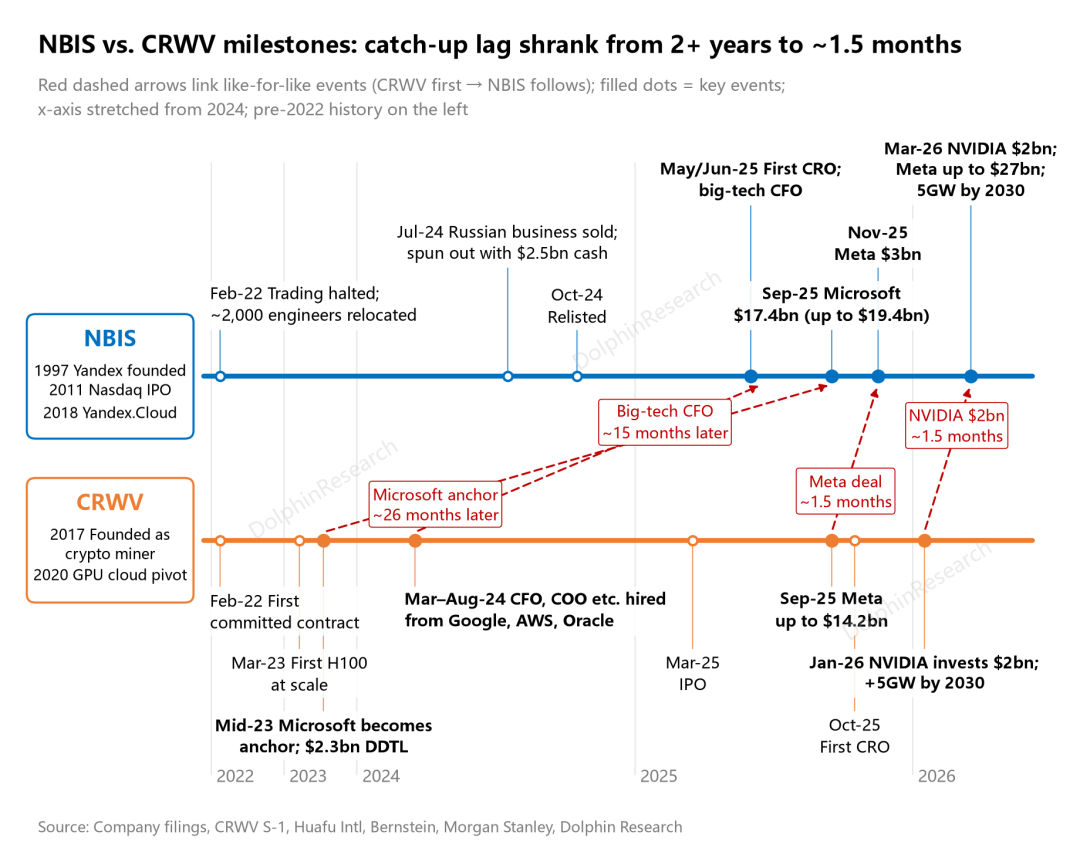
In terms of management, each filled its own shortcomings: CRWV, in the year before its IPO (2024), brought in CFO, COO, and product and engineering heads from Google Cloud, Amazon AWS, Oracle, and others to build cloud business capabilities;
what NBIS lacked was commercialization and capital markets experience. Starting in 2025, it successively brought in a CFO who had worked at Amazon, as well as a CRO (Chief Revenue Officer) and CMO (Chief Marketing Officer) from Twilio and MuleSoft.
Now the professional manager layers of the two are the same configuration, with the only difference remaining at the founder level.
1.2 With Nvidia: same equity investment, but CRWV is more deeply tied
This year Nvidia invested about $2 billion in each, with similar shareholding ratios, but the timing of entry and the depth of business ties differ greatly.
CRWV is Nvidia's absolute "favored child," and can even be called an off-balance-sheet liability. Nvidia was a shareholder very early; in business there are multiple ties:
a. Nvidia is CRWV's main supplier; it also rents compute power from CRWV, making it a customer; and it has promised to buy part of CRWV's unsold capacity, providing a revenue backstop;
b. Starting this year, it has also used its own financial statements to help CRWV accelerate acquisition of land, power, and data centers. It can be said that CRWV is the sharp knife Nvidia uses to pry open the cloud giants' alliance.
NBIS is more like a later "bet" by Nvidia. Nvidia previously only made small follow-on investments, and only this year made a large equity investment through pre-funded warrants;
cooperation is concentrated at the technical level, including priority supply for new platforms, AI factory design, inference software, and cluster monitoring. The technical treatment of the two is not much different, but the operational and financial ties are not deep.
1.3 The valuation gap is not as large as it appears
Before comparing item by item, first squeeze out the "water" in the valuation gap at the beginning: of the apparent roughly 3x valuation gap, more than 60% comes from the difference in capital structure between the two.
CRWV expands through debt: based on the October 26 closing price, market cap accounts for only about half of its enterprise value (EV) (market cap about $30.4 billion, net debt about $28.4 billion). NBIS has more cash than debt on its books, with EV of about $45 billion, slightly higher than market cap due to dilution from Nvidia warrants and in-the-money convertible bonds (about $9.6 billion), after deducting net cash and equity investments (about $6.3 billion).
After switching to EV, based on 2027E revenue, NBIS is about 3.7x and CRWV about 2.2x, narrowing the gap from about 3x to about 1.7x.
II. Revenue prospects: CRWV more stable, NBIS more elastic
The revenue side hinges on two points: first, growth, i.e., which has greater elasticity; second, certainty, i.e., which has higher revenue visibility and is more resistant to downside risk.
Conclusion first: the two are two business models, with good and bad from the same source.
CRWV is mainly based on take-or-pay long-term contracts, more like "operating data centers on behalf of customers" for a few large clients. Volume and price are largely locked at signing, about 80% of expected revenue over the next two years is covered by RPO, and industry downturn risk is borne more by customers, at the cost of weaker bargaining power and limited upside elasticity.
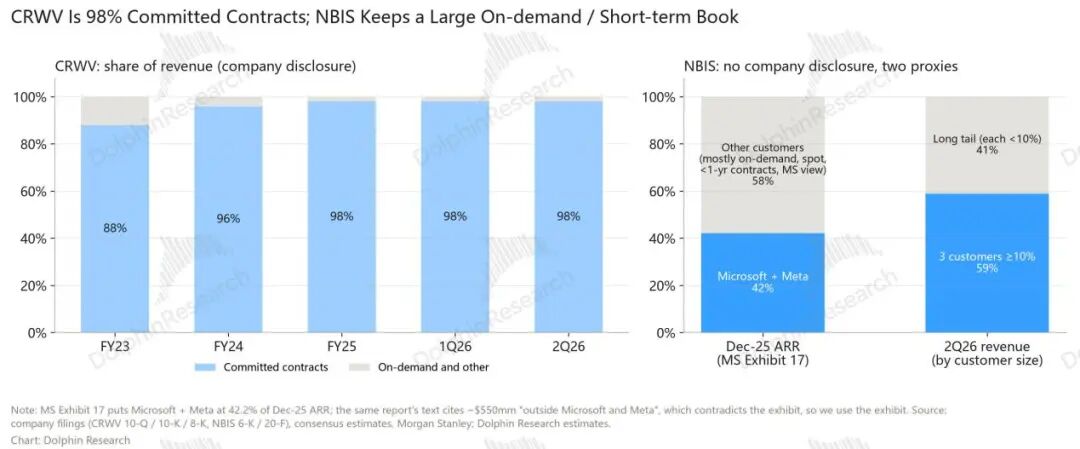
NBIS has a higher proportion of on-demand and short-term contracts and a more dispersed customer base, more like a traditional cloud platform: aggregating demand from many customers and setting prices independently, with greater elasticity in unit price, revenue, and profit when supply and demand are tight; but RPO covers only about half of expected revenue over the next two years, and returns and risks are borne more by itself. If supply and demand reverse, there is a lack of long-term contract protection.
2.1 Order backlog: CRWV has higher revenue certainty
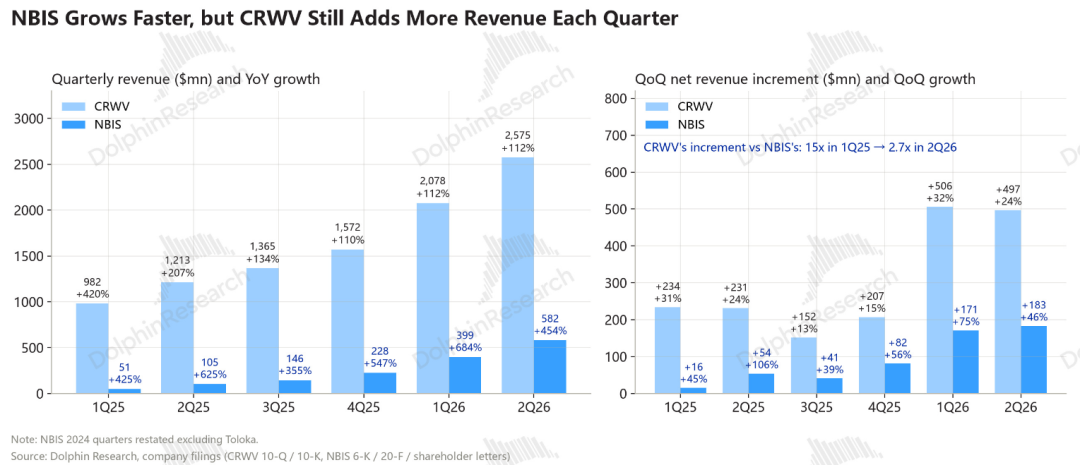
In terms of relative growth, NBIS is much faster; but in terms of absolute scale, CRWV is still much larger. Even by quarter-on-quarter incremental amount, CRWV is nearly 2.8 times NBIS.
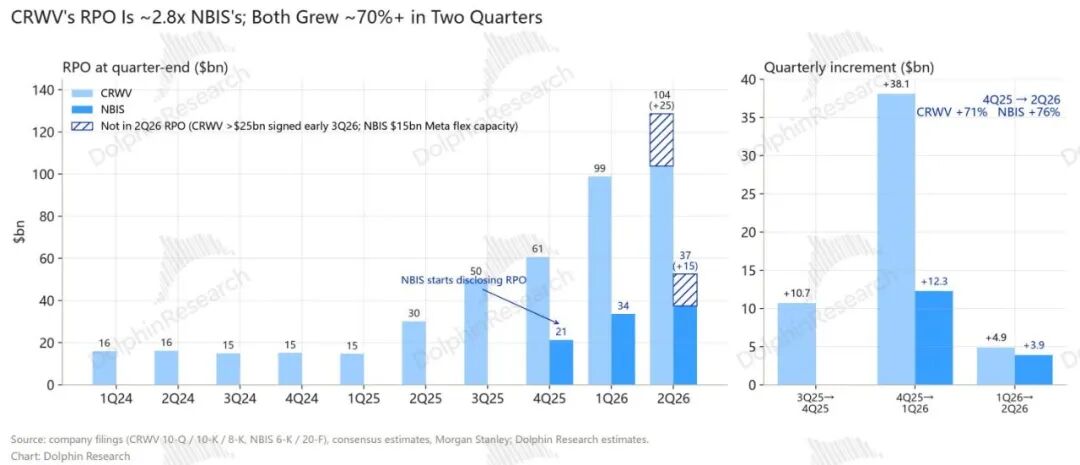
More importantly, look at the next growth: future revenue depends on order backlog (RPO, remaining performance obligations). CRWV is clearly superior here:
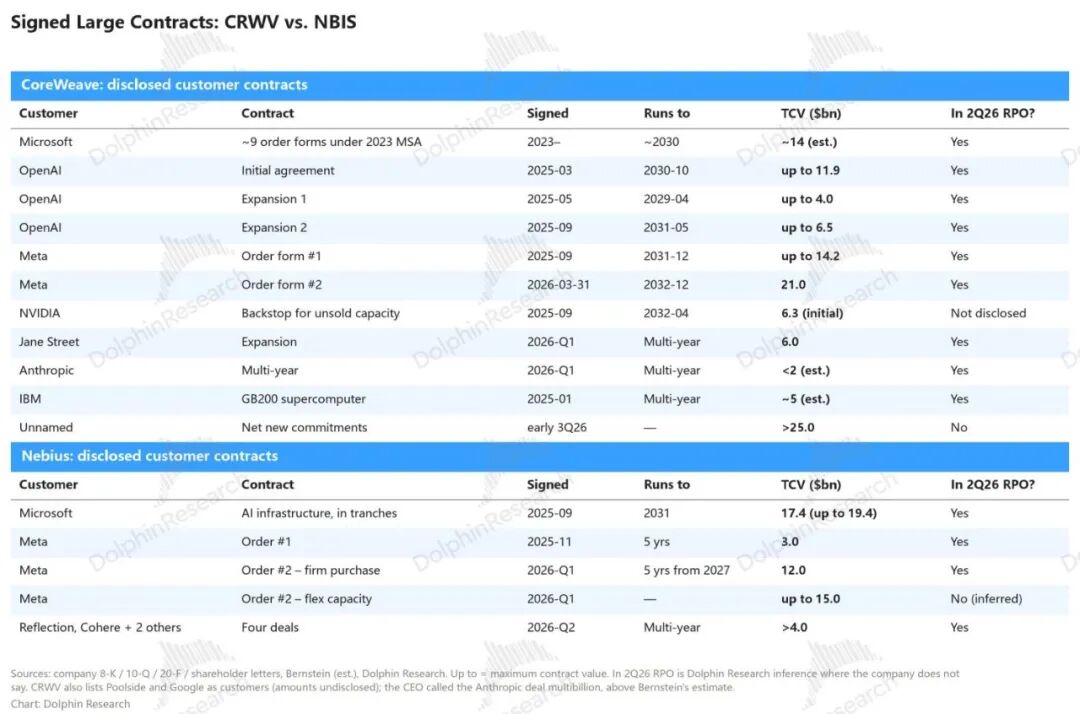
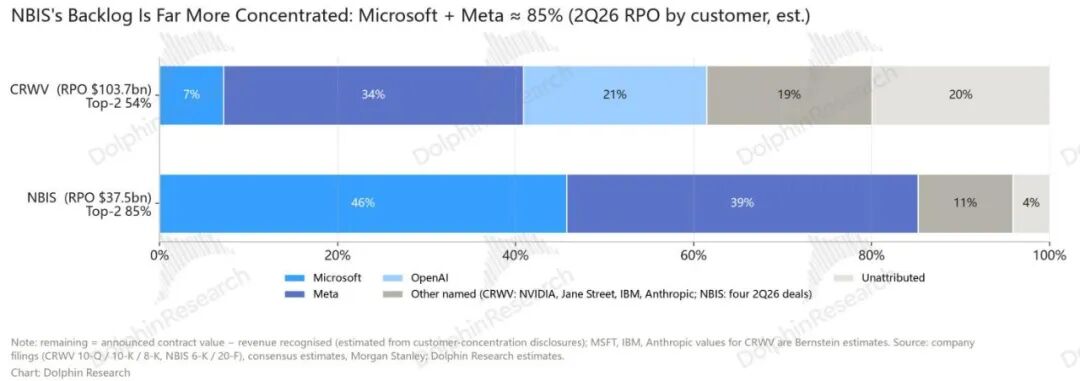
NBIS's RPO scale is only about 1/3 of CRWV's, and about 85% is concentrated in two customers, Microsoft and Meta; while CRWV's top 2 customers (Meta and OpenAI) together contribute about 54%.
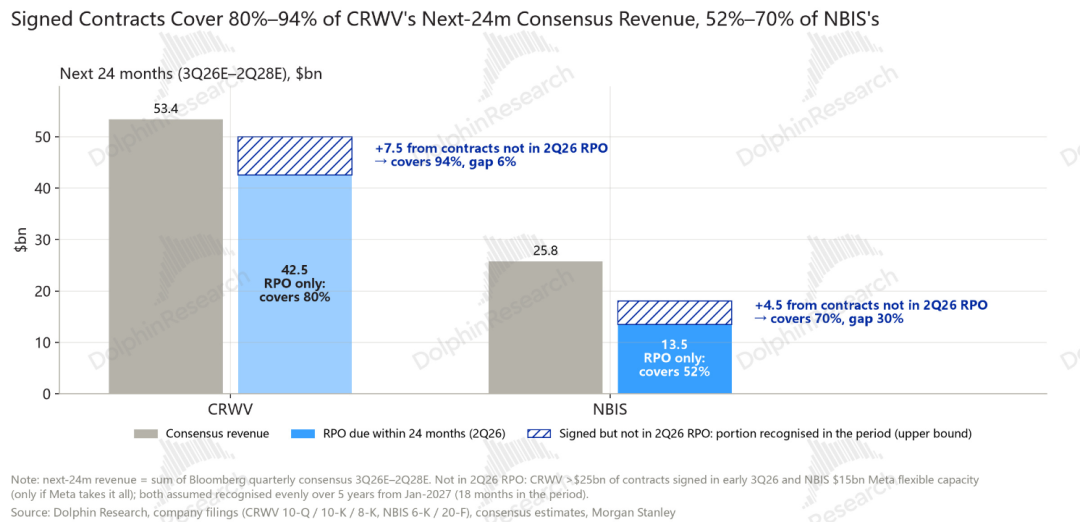
As of 2Q26, CRWV's RPO was $103.7 billion, and NBIS's was $37.5 billion. About 80% of CRWV's expected revenue over the next 24 months is already covered by RPO, while NBIS is only about 52%.
To some extent, NBIS chooses to leave a large amount of its capacity freely priced in order to sell at higher prices under current market conditions.
2.3 Contract-based vs on-demand: two models with good and bad from the same source
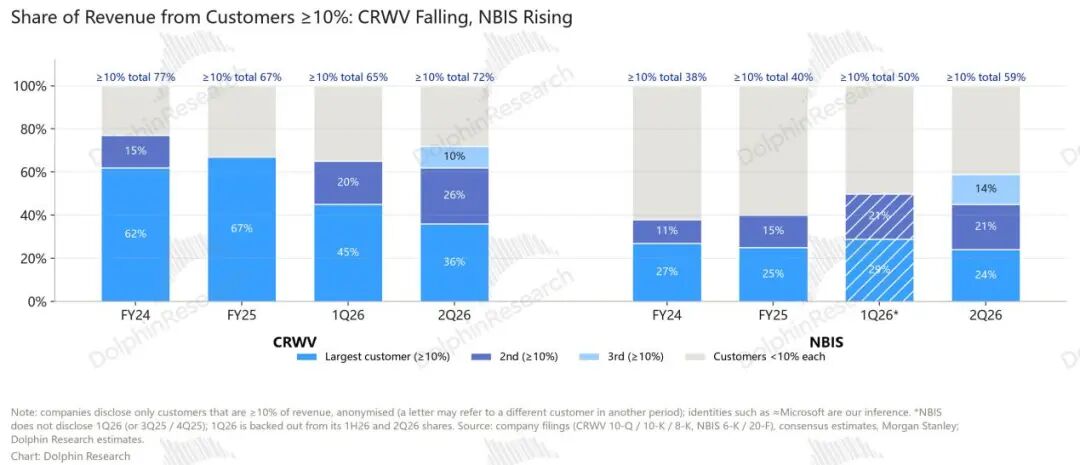
Although NBIS is more concentrated in RPO, its revenue customer base is actually more dispersed. In 2Q26, CRWV's three largest customers together accounted for 72% of revenue, while NBIS was 59%.
The contrast is as mentioned above: NBIS mainly relies on current sales and short-term contracts, with small and numerous customers; CRWV has almost all revenue (about 98%) from multi-year contracts.
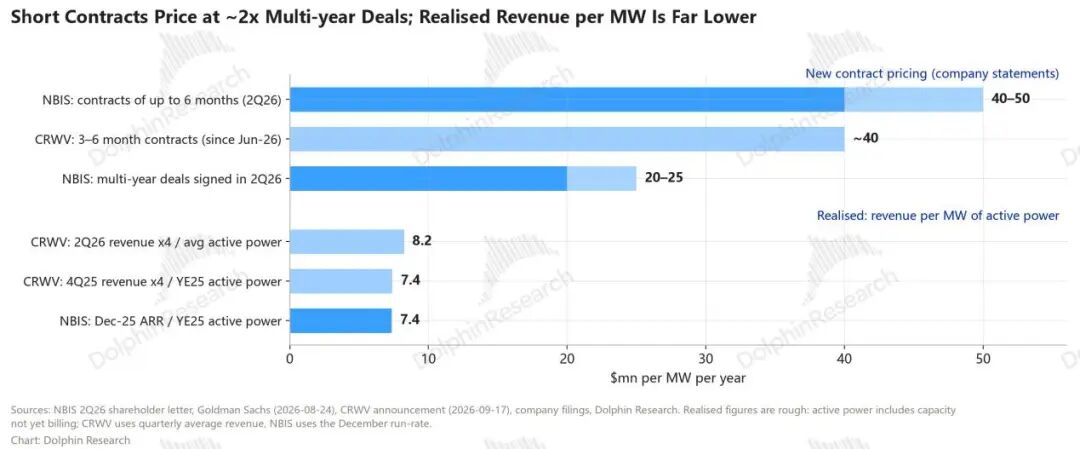
NBIS does this to fully capture the upside of GPU rental prices: in 2Q26, NBIS's new long-term contract price was about $20-25 billion/GW per year, but in the third quarter short-term contracts already exceeded $40 billion. Old agreement prices may have been only $8-10 billion.
But when the industry enters a downturn and GPU rental prices fall, short-term and on-demand revenue will be hit first, unlike long-term contracts that are "secure regardless of drought or flood," and may even drop directly to zero.
In this case, what is tested is NBIS's efficient execution—whether it can convert Capex into revenue at the fastest speed during the price dividend period.
III. Profit margin: apparent 28-point gap, actually similar
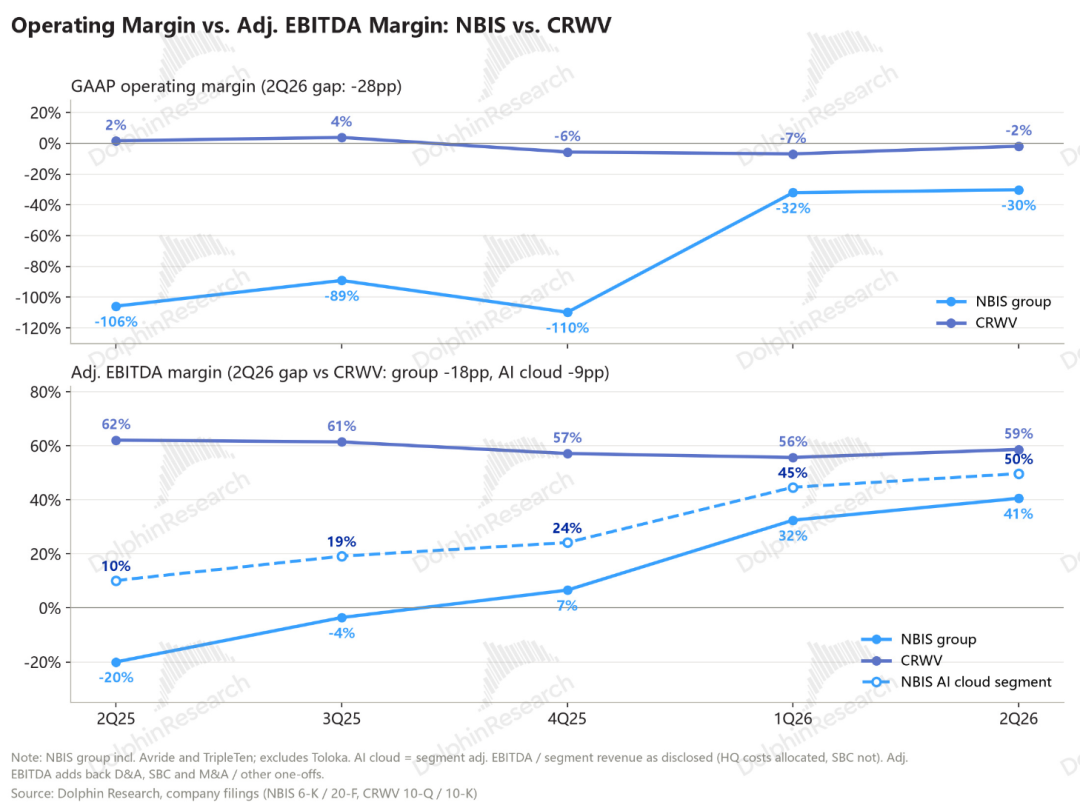
Conclusion first: CRWV's operating margin appears about 28 points higher than NBIS's, but the gap lies in NBIS's side business losses, higher sales expenses, and SBC. Looking only at cloud, the difference is actually only 9 points.
On infrastructure costs, NBIS is actually more economical on paper than CRWV, mainly because some data centers are self-built, and plant investment is depreciated over 20 years and listed separately together with other depreciation, resulting in lower book expenses.
In the chart below, CRWV's profit margin has been largely stable over the past year or so, while NBIS's is rapidly improving.
3.2 Costs and expenses: free selling, higher sales spending
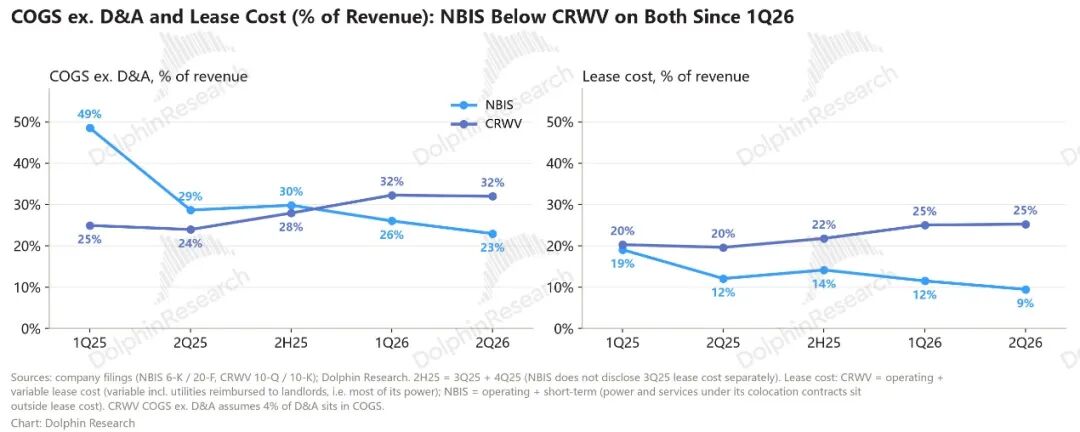
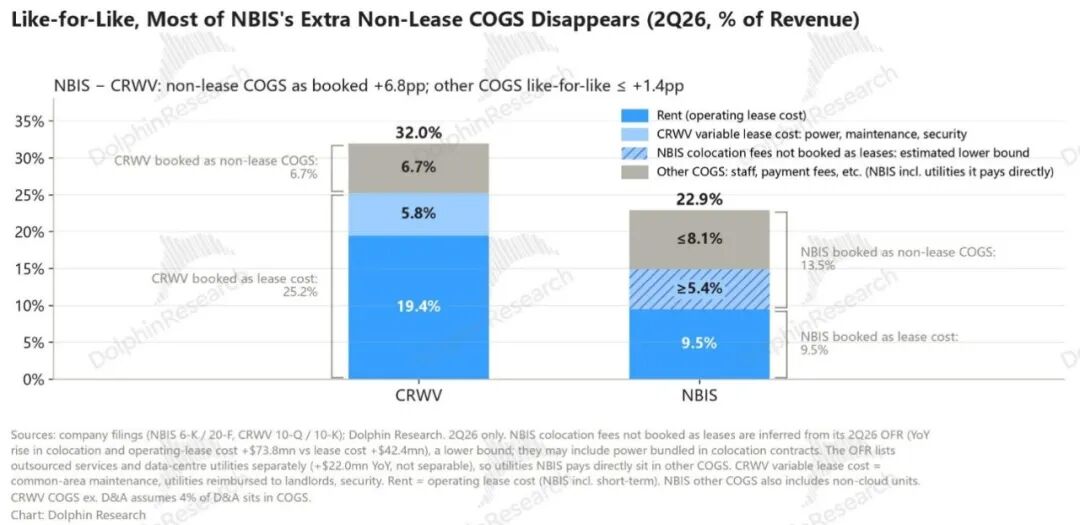
① Under the self-built data center model, NBIS's 23% cost ratio is lower than CRWV's 32%. The main reason is, as mentioned above, the different accounting treatment:
All of CRWV's data centers are leased, and the rent goes entirely into cost of sales; of the 21 data centers planned by NBIS, 5 are self-owned, and the spending goes into depreciation and amortization rather than cost of sales. Excluding the rent accounting difference, the two companies' power and O&M cost ratios are actually basically the same.
Moreover, under this approach, NBIS's depreciation ratio will not be much higher either, because property and plant are depreciated over about 20 years, far longer than the roughly 5 years for IT equipment, so property depreciation as a share of NBIS's total depreciation will most likely not exceed 10%. The only cost is higher upfront cash Capex.
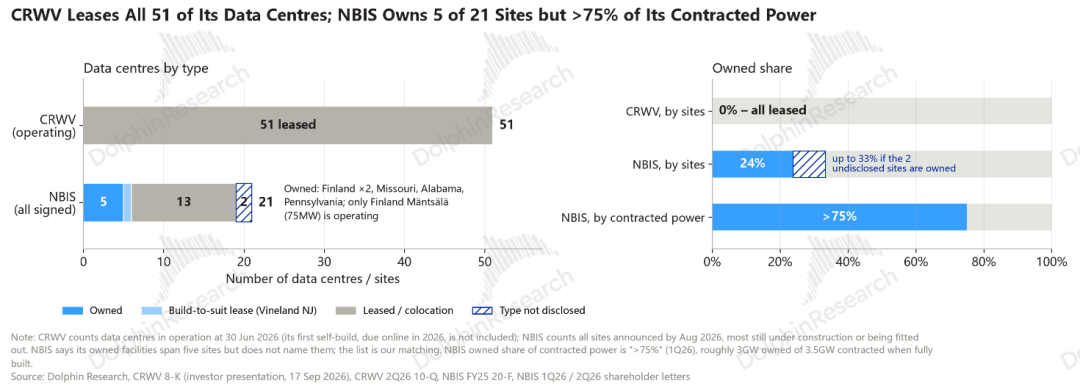
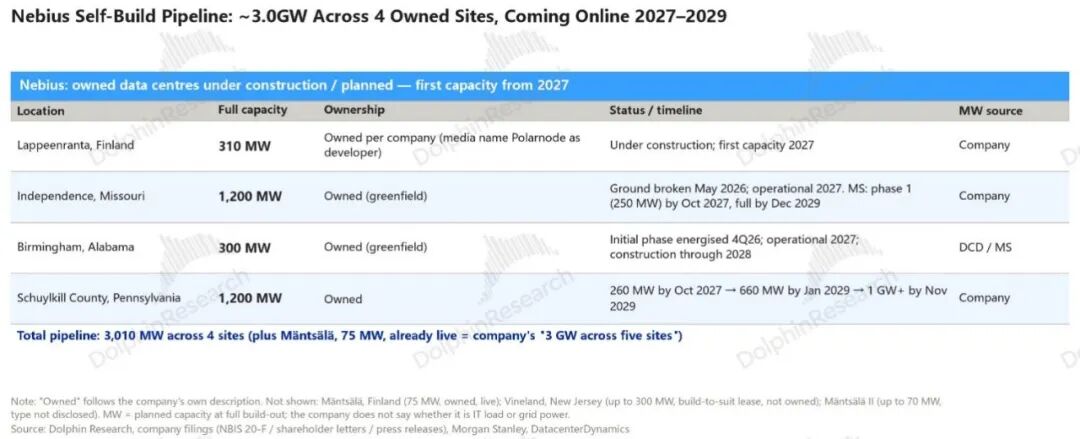
Currently, only one self-owned data center is in operation, located in Finland, with 75MW of capacity, accounting for about 44% of NBIS's online compute power by the end of 2025. Going forward, NBIS's rent will surge:
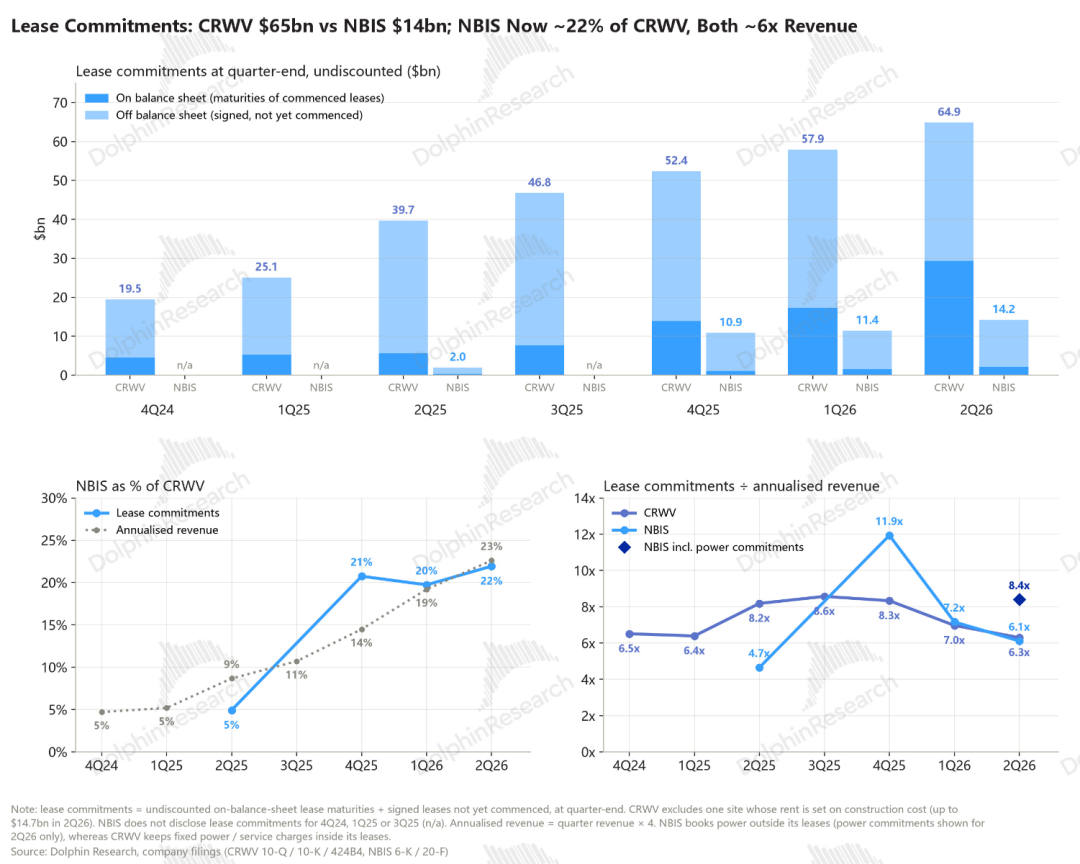
Total on- and off-balance-sheet lease liabilities rose from about $2 billion in 2Q25 to more than $14 billion in 2Q26, and will gradually take effect in 2026-27. However, subsequent buildout will still be mainly self-built; of the 5GW locked in by the end of 2026, about 3GW comes from self-owned properties.
② Depreciation: NBIS's depreciation ratio is currently lower, but this may not last
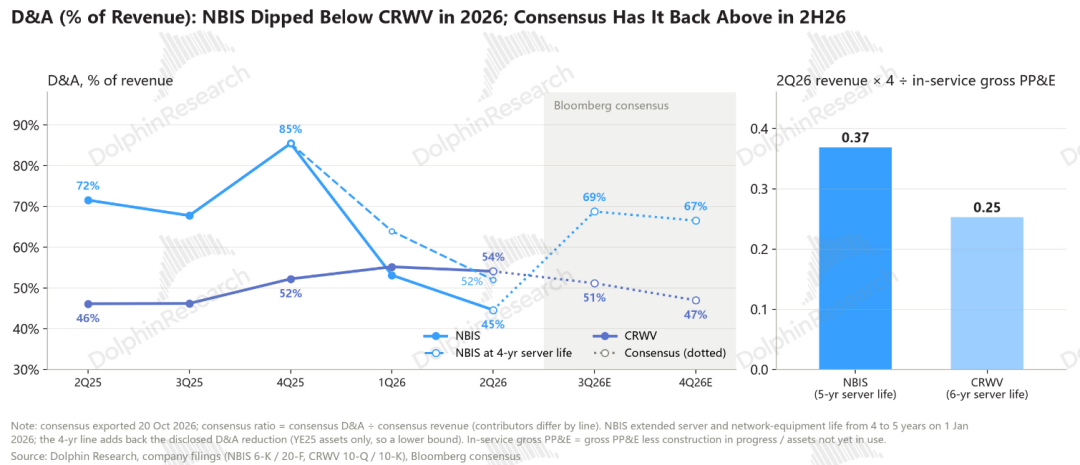
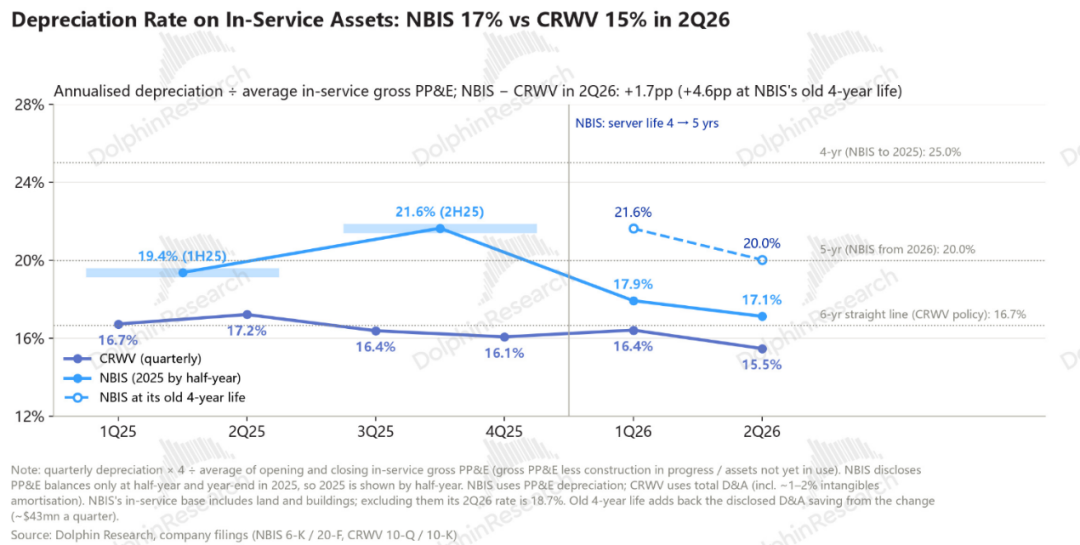
In 2Q26, depreciation and amortization accounted for 54% and 45% of revenue for CRWV and NBIS, respectively. After adding back depreciation expense, the true gross margin in 2Q26 was 32% for NBIS and about 14% for CRWV, with NBIS still ahead by about 18 points:
First, NBIS's rental prices have risen more in recent quarters, generating more revenue from the same assets.
Second, a large number of assets are still under construction and have not yet begun to be depreciated: NBIS's not-yet-in-service assets exceed those already in service ($7.8 billion vs. $6.3 billion);
when they are concentratedly put into use from the end of this year to the first half of next year, depreciation will arrive before revenue, and the depreciation ratio will likely rise significantly, possibly overtaking CRWV.
But such a comparison is unfair, because much of CRWV's capacity is actually delivered under short-term contracts, requiring sales staff for BD and maintenance, hence a higher density of expense investment, which reflects a business model choice.
Therefore, what should really be compared is true gross margin minus sales expense ratio, to look at the gross-to-selling spread margin: in 2Q26 excluding SBC, NBIS's sales expense ratio was as high as 25%, while CRWV's was only about 5.5%.
After subtracting this expense, NBIS's gross-to-selling spread margin is 7%, actually lower than CRWV's 8.5%.
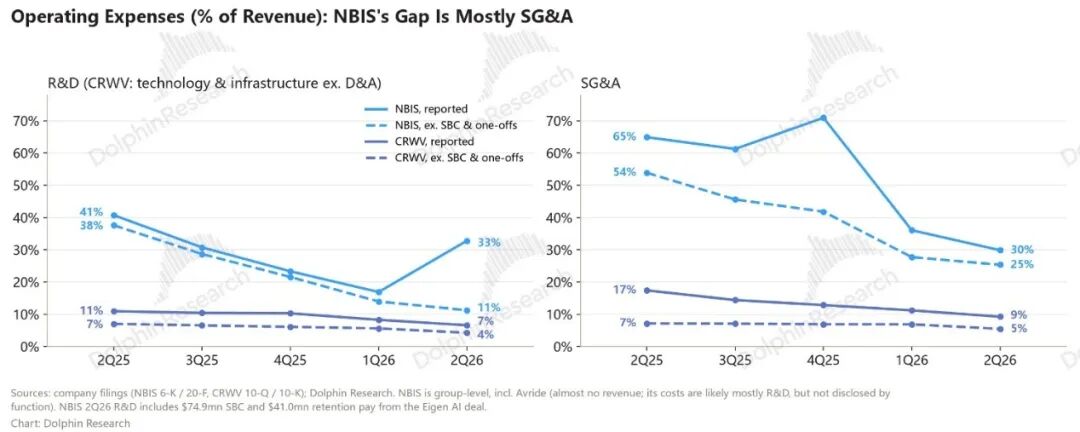
Summary: NBIS has more upside
In Dolphin's view, this is where the fair comparison lies: with revenue only about 1/4 of CRWV's, NBIS's gross-to-selling spread margin has nearly caught up, and NBIS's margin has more room to rise in the future.
Other SBC and M&A are distracting factors and need not be overemphasized:
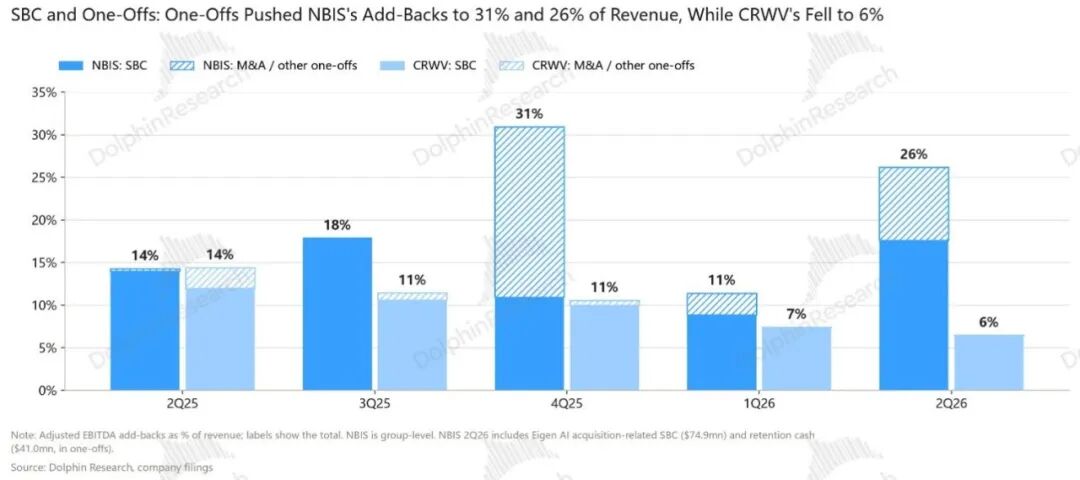
The key question next is: how much extra investment is needed for the compute power saved by self-built facilities? Where will the money be raised? Let's move on to the two companies' capital investment.
IV. Compute power and Capex: NBIS builds faster and raises prices more
Conclusion first: NBIS invests more aggressively in Capex, but builds faster, so revenue will ramp up more quickly, though unit compute cost is slightly higher.
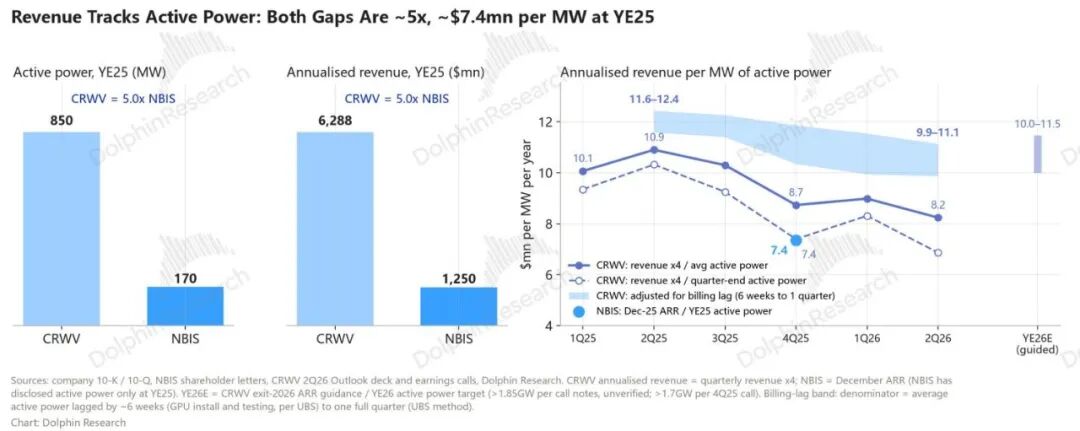
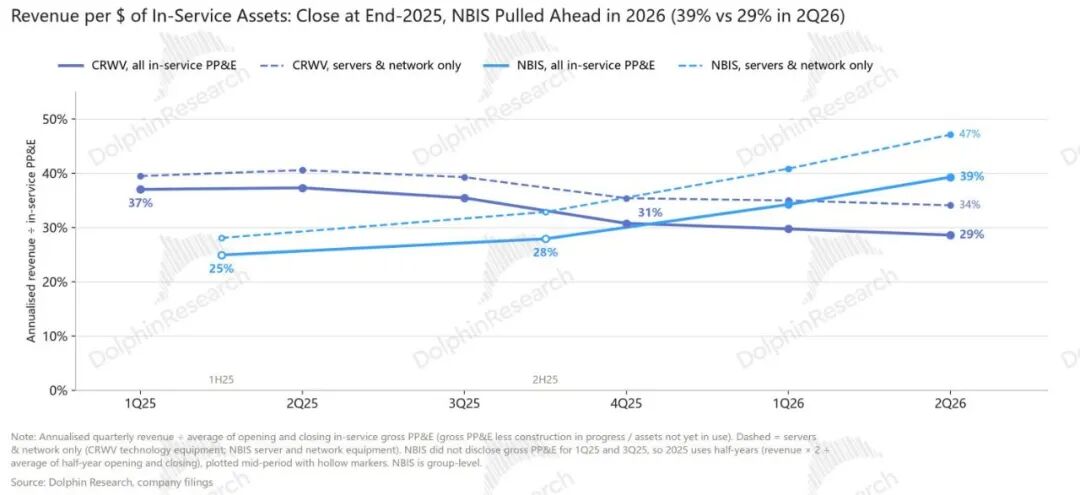
At the same time, short-term contracts bring higher revenue elasticity per watt, and asset revenue generation efficiency rose all the way from about 25% in 1H25 to about 39% in 2Q26. CRWV, due to long-term contract price locking, shows a less obvious upward slope.
Again, choosing market-based pricing is essentially a test of project execution efficiency.
4.2 Power: NBIS has locked more, but what is truly comparable is the scale online in 2030
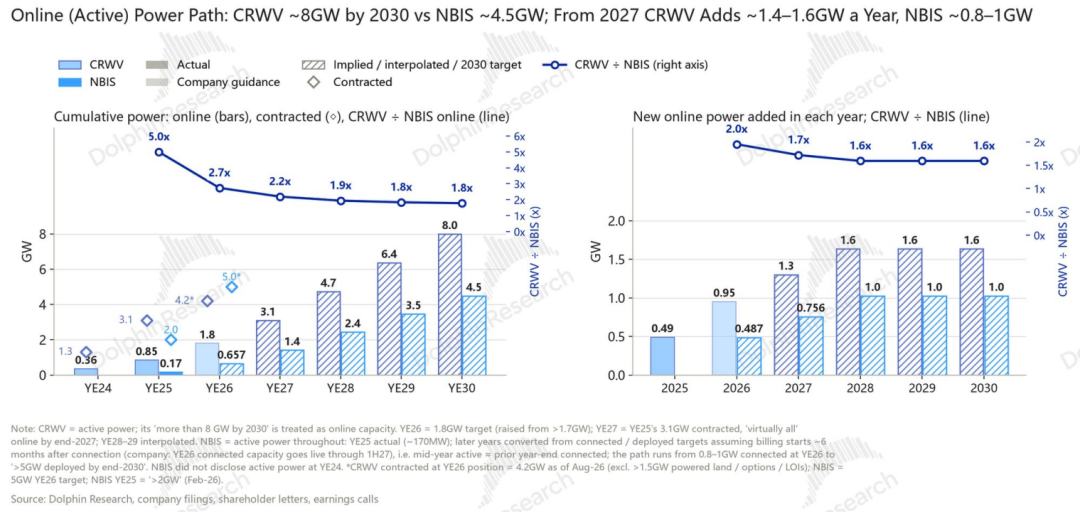
In terms of locked power, NBIS aims to reach 5GW by the end of 2026, higher than CRWV's about 4.2GW as of August, but signed capacity alone is meaningless; what really matters is power "online":
a. CRWV's signed power has a clear online timetable (3.1GW basically all online by the end of 2027);
b. Most of NBIS's is long-term self-built parks, with only 0.8-1GW connected by the end of 2026, and more than 1GW deployed each year after 2027, so digesting 5GW will take until 2030-31.
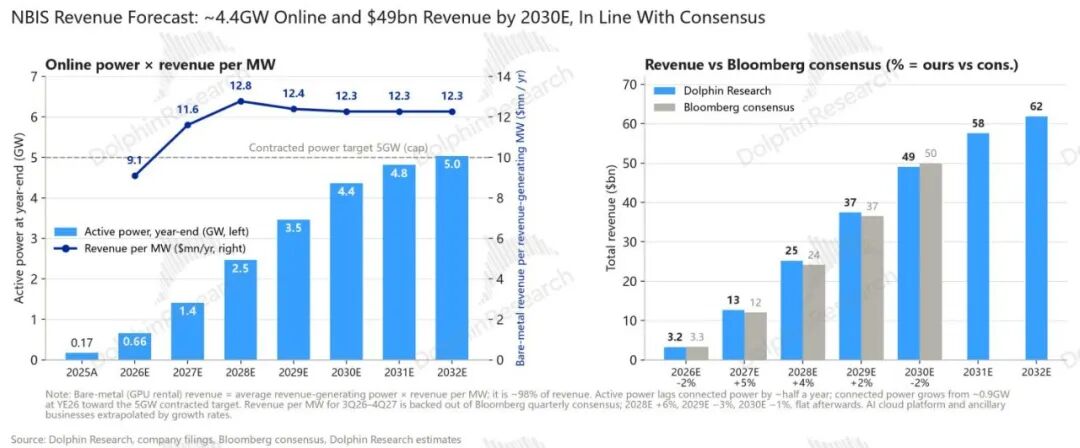
By 2030, CRWV plans more than 8GW; NBIS plans to connect 5GW, and with billing lagging by about half a year, about 4.4GW will be online.
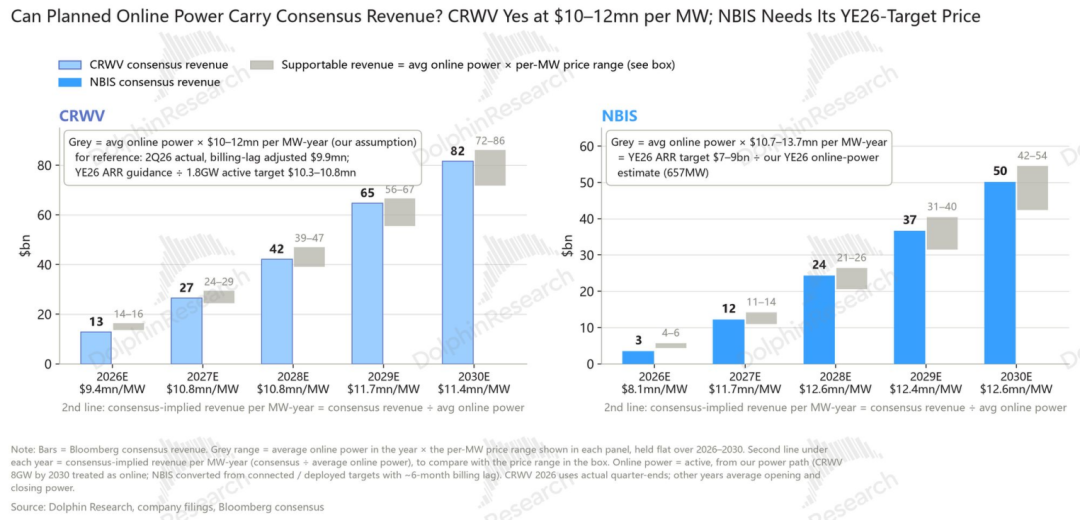
Can this compute power support the consensus revenue expectations for 2030? Back-calculating from the compute power online by 2030, CRWV needs about $11.4 million of annual revenue per MW.
NBIS needs about $12.6 million, implying the latter raises prices more, or implying that it must sustain a continuous "free selling" premium going forward.
4.3 Capex: NBIS invests more aggressively, mainly because it builds faster, and unit cost is slightly higher
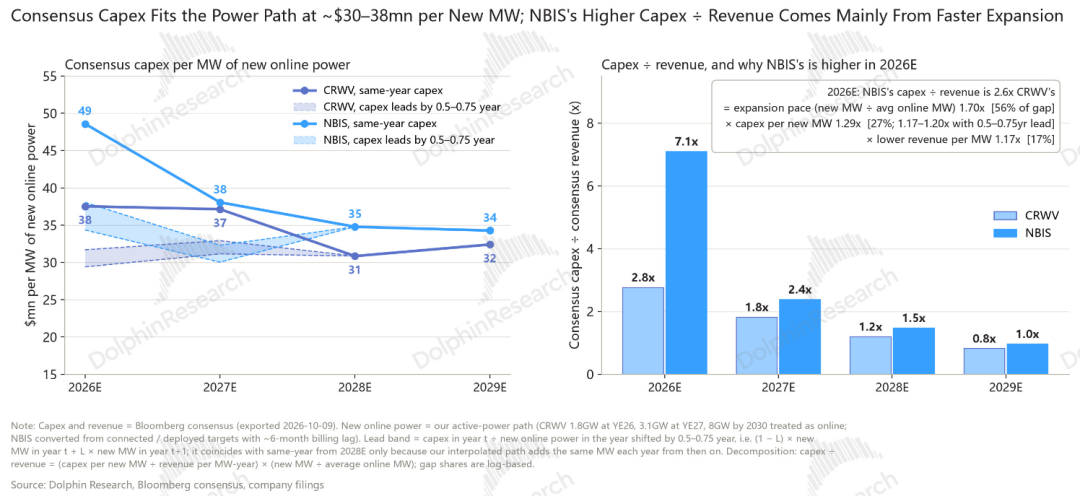
Calculated on a present-value-paid basis, NBIS's Capex relative to revenue is more aggressive: NBIS was $8.1 billion in 1H26, 8.3 times its revenue for the same period; CRWV was $14.1 billion, about 3 times revenue.
Judgment: NBIS is building more, with slightly higher unit compute cost
NBIS is investing madly, with many assets invested but not yet producing, and a large amount of capacity will come online from the end of 2026 to 2027. CRWV has far less under construction relative to in service, and a high under-construction share inevitably means high investment.
Dolphin matches Capex leading online by half a year to three quarters, and NBIS's cost per GW ($35 billion) is nearly 20% more expensive.
V. Sources of funding: CRWV relies on debt, NBIS on advance receipts and equity
Business model choices are not right or wrong over the long term; the key is where the money comes from and at what cost, and whether the chosen model matches one's own capabilities.
CRWV's "operate on behalf of customers" model raises money through project loans (DDTL) secured by customer contracts, which are essentially debt-like assets.
NBIS is an asset where "shareholders bear the risk themselves," with funding mainly from shareholders: secondary offerings, convertible bonds, plus advance receipts from major customers, at the cost of continuous share dilution.
In Dolphin's view, for NBIS, equity can be diluted, but execution must be efficient, quickly converting financing into high-unit-price revenue that outruns equity dilution.
5.1 Where the money comes from: 60% of CRWV's from debt issuance, 60% of NBIS's from equity
In 1H26, about 60% of CRWV's cash Capex was funded by net new debt; at first glance NBIS's financing channels are roughly three-way: customer advance receipts, convertible bonds and equity each contributing $4-5 billion, but convertible bonds may ultimately convert into shares, so overall it is mainly equity financing.
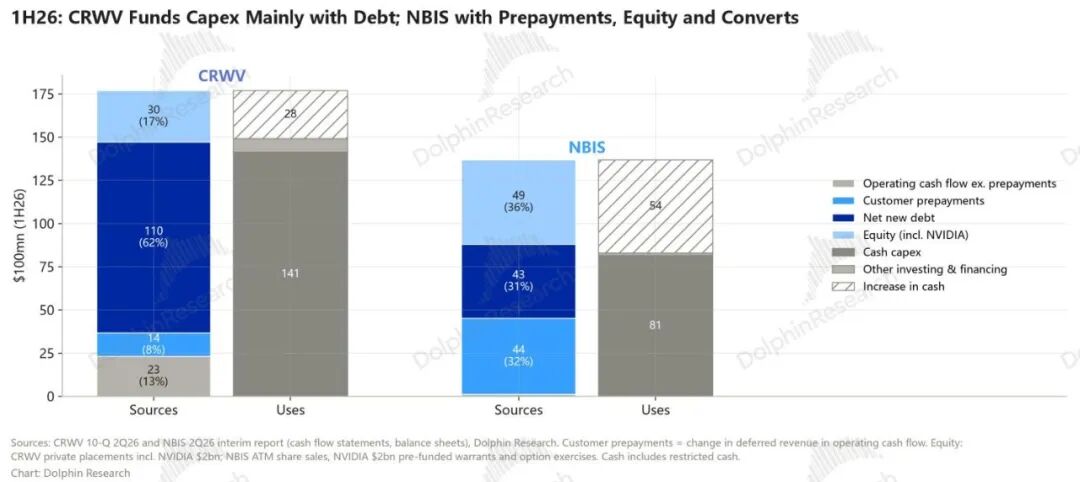
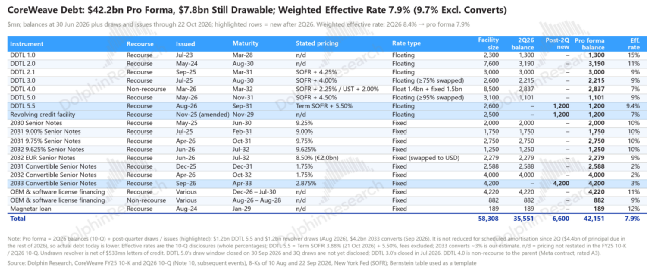
5.2 Debt: CRWV borrows more, and rates are rising; NBIS only has convertible bonds, at the cost of dilution
Borrowing-heavy models favor low borrowing costs, but the resulting cloud service prices are high; this is essentially a spread business.
CRWV's DDTL interest cost had been falling all along, but by August it had climbed to 9.4%, with the secondary market implying 15%, so the financing environment has recently deteriorated.
Costs are rising, but on the revenue side long-term contracts lock in upward revenue elasticity, so the result is narrowing spreads and inevitably compressed valuation.
Current cloud rental prices clearly favor NBIS's business model: equity is indeed diluted, but as long as execution is fast, the money raised can quickly become revenue-generating capacity, and as long as revenue clearly outruns equity dilution, the math is worth it.
As for the cost, based on the October 26 share price, the four tranches issued in 2025 are expected to convert, and together with Nvidia's warrants, potential dilution of current shareholders' equity is as high as 23%.
By contrast, selling cloud services at market prices can bring higher revenue elasticity, with potential revenue of nearly 100% from 2026 to 2030.
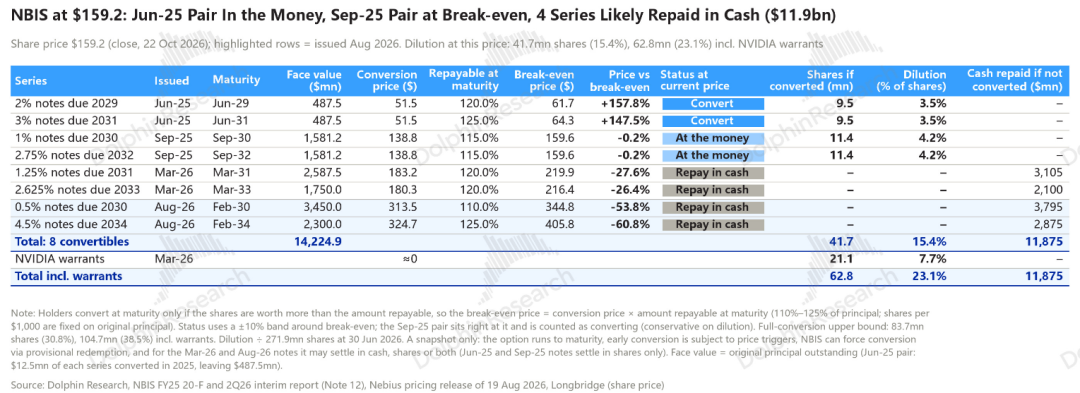
Under this logic, NBIS will inevitably go all out to deploy compute power, frantically converting financing into revenue-generating deployed capacity during the supply-demand gap. The result is that NBIS's cash burn relative to revenue is more aggressive.
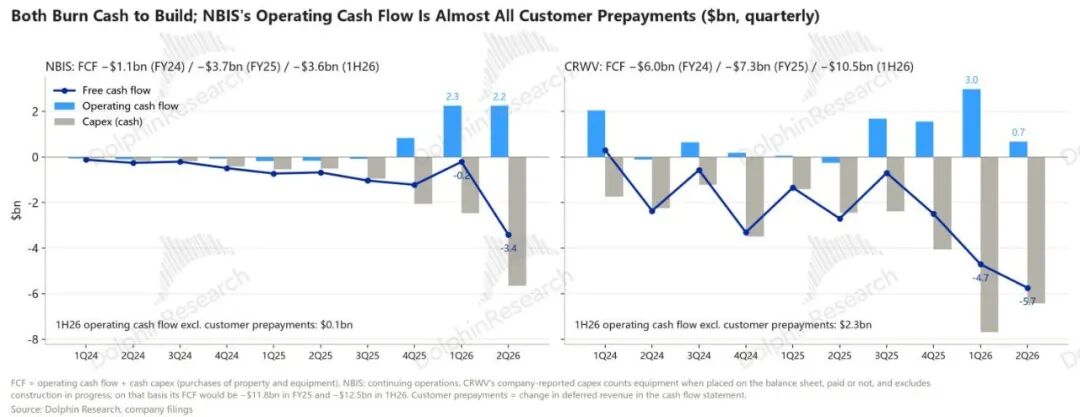
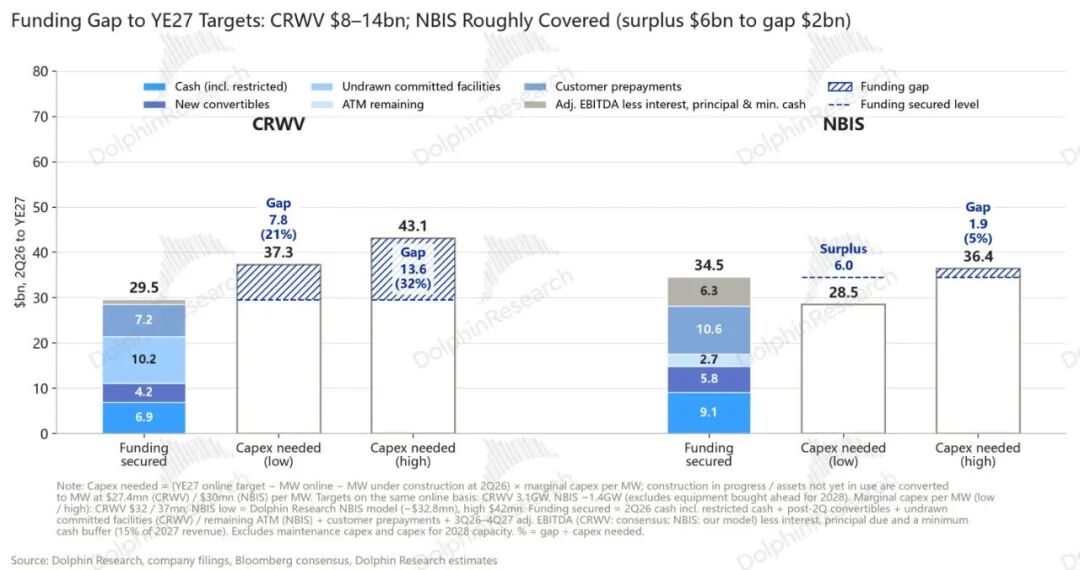
5.3 Funding gap: the benefit of equity financing - NBIS is actually under less pressure
The reason here is simple: because NBIS uses equity financing, principal and interest payments are a small share. Operating cash flow can be used to deploy capacity rather than pay interest.
VI. Is NBIS worth it?
In summary, it is actually clear that the current cloud rental market favors NBIS's business choice:
During the price dividend period, revenue elasticity is higher, equity financing dilutes shares without principal and interest costs, and NBIS just needs to charge ahead, quickly bring compute power online, and recover its investment.
Even if prices decline, if shareholders are willing to put in money, that is their own choice to bear the risk. It is just that when cloud rental prices fall, its model of financing to generate revenue basically stops working, and its stock price will fall even harder. It is essentially a high-beta stock on cloud rental prices.
But CRWV's revenue is locked in through long-term agreements, so a high-interest-rate environment is eroding its interest spread, and because borrowed funds are used over the long term, this cost will be locked into costs for years to come, leaving limited business flexibility.
6.1 Neutral expectation:
Costs are relatively fixed; the main variable is forecasting revenue per watt. Under the neutral expectation, Dolphin Research believes the current revenue of around $35 billion per GW is unsustainable.
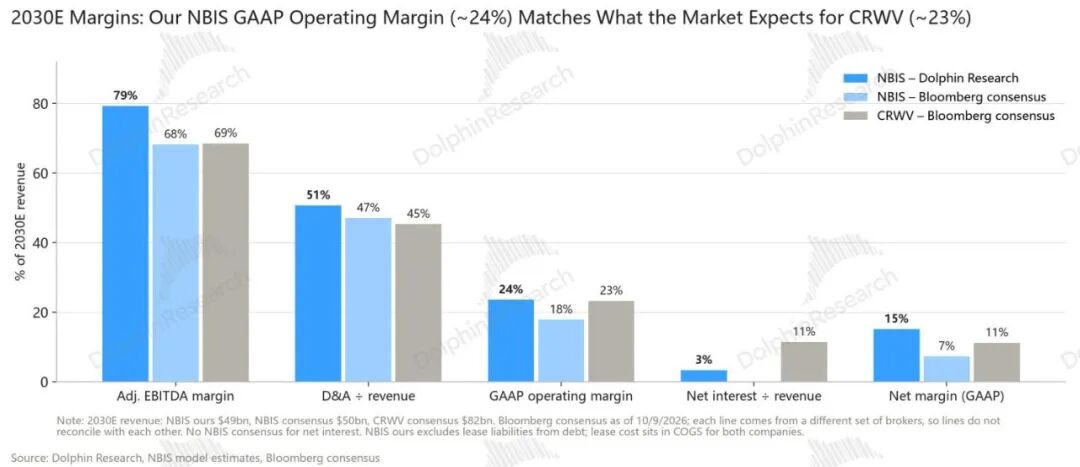
Therefore, it is expected that the average price will rise from a baseline of about $10 billion in 2030 to about $12.5 billion, with adjusted EBITDA of $9.9 billion per GW (corresponding to a payback period of about four years) and a profit margin of 79%. After subtracting amortization and depreciation of about $3 billion, operating profit is about $2.4 billion, a margin of 24%.
This is higher than market expectations. This is mainly due to the economies of scale in unit costs and R&D expenses as revenue per GW rises. Ultimately, GAAP operating profit turns positive in 2027 and reaches about $11.6 billion in 2030, with a margin of about 24%.
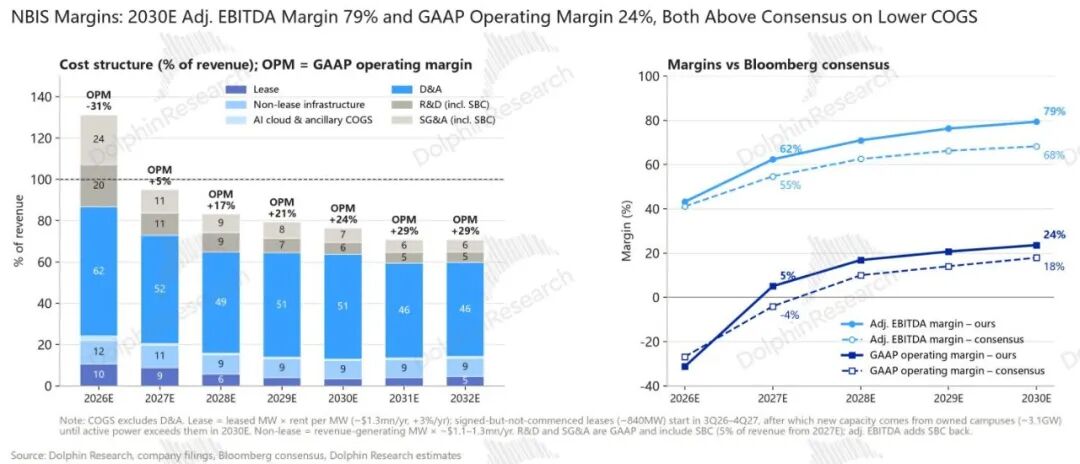
The core of the cost-side assumptions is that servers can still be rented out at close to their original price after depreciation is fully taken, and that investment per MW will no longer rise during upgrades.
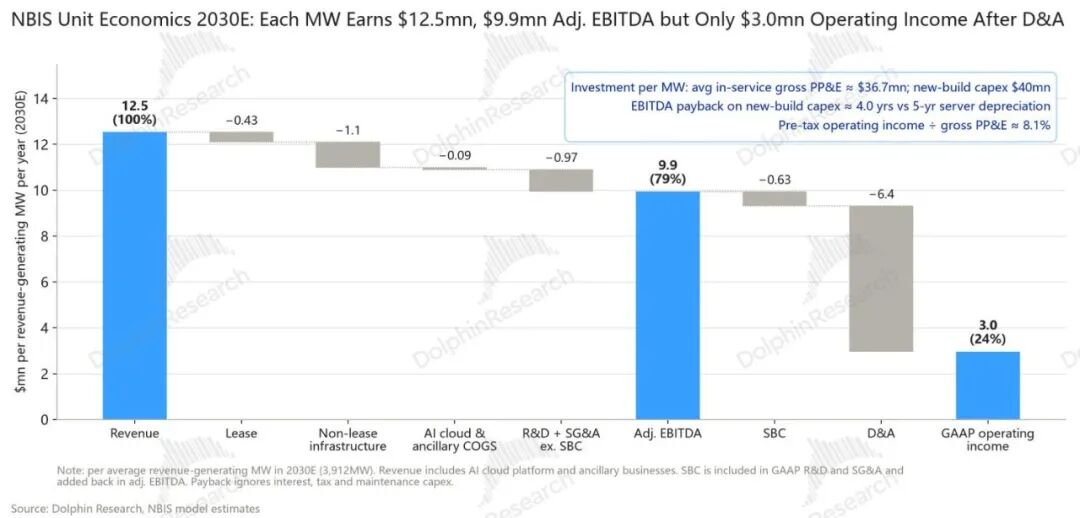
6.2 Value analysis: per-MW pricing determines the upper and lower limits
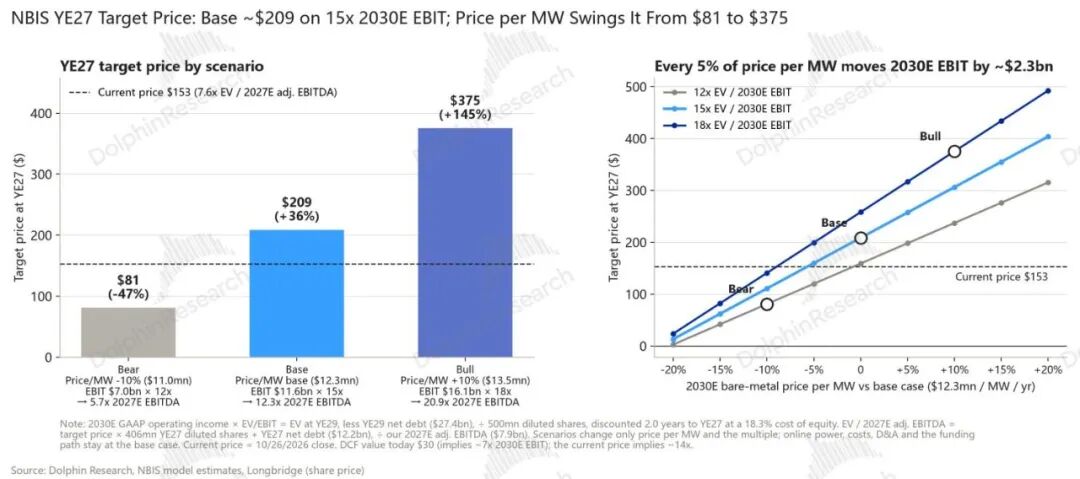
Its stock price fluctuations also become simple: if computing power supply ends up being excessive and the per-GW price falls to only 90% of the neutral case, its stock price will plummet.
Under the optimistic scenario, based on a neutral rental price of $12.5 billion plus 10%, the per-share price rises sharply.
This also shows how highly sensitive its valuation is to cloud rental prices!
In essence, it is a highly leveraged business under an asset-heavy model—once costs are invested, they are rigidly locked in. Profit elasticity, and further valuation elasticity, both depend on revenue elasticity per watt; more revenue means more profit.
As for the equity dilution caused by so-called financing—with share capital of 500 million by the end of 2030, 80% more than 270 million in 2Q26—as long as revenue elasticity is strong enough, it can all be offset.
Overall, because NBIS chose to allocate more of its relatively greater capacity to short-term contracts with high price elasticity rather than to long-term agreements with high certainty, it can enjoy higher performance and valuation elasticity during periods when computing power supply is tight and rental prices are rising. Therefore, when cloud rental prices are rising, NBIS is the top choice among new cloud players.
But conversely, when the market declines and computing power prices fall, because it lacks the floor protection of long-term agreements, its performance and the valuation premium it currently enjoys will also have greater downward elasticity.
Therefore, when noticing the turning point of falling computing power prices, one must also completely abandon NBIS. Because it may fall into a miserable situation of no contracts, no revenue, but rigid computing power expenditure.
- END -
// Reprint permission
This article is an original piece by Dolphin Research. If you wish to reprint it, please obtain authorization first.
// Disclaimer and General Disclosure Notice
This report is intended solely for general informational purposes, providing a broad overview for readers and data reference for users of Dolphin Research and its affiliates. It does not take into account the specific investment objectives, product preferences, risk tolerance, financial circumstances, or particular needs of any individual recipient. Investors who base investment decisions on this report should consult an independent professional adviser before making any investment. Anyone who makes investment decisions based on the use of or reliance on the content or information mentioned in this report does so at their own risk. Dolphin Research accepts no liability for any direct or indirect loss arising from the use of the data contained herein. The information and data in this report are derived from publicly available sources and are provided for reference only. While Dolphin Research strives to ensure the reliability, accuracy, and completeness of the relevant information and data, it does not guarantee these qualities.
Nothing in this report—whether information mentioned or views expressed—shall be treated or construed, in any jurisdiction, as an offer to sell securities or a solicitation to buy or sell securities, nor does it constitute advice, solicitation, or recommendation concerning the relevant securities or related financial instruments. The information, tools, and materials contained in this report are not intended or proposed for distribution to citizens or residents of any jurisdiction where such distribution, publication, provision, or use would contravene applicable laws or regulations, or would require Dolphin Research and/or its subsidiaries or affiliates to comply with any registration or licensing requirements in that jurisdiction.
This report reflects only the personal views, opinions, and analytical methods of the relevant authors and does not represent the position of Dolphin Research and/or its affiliates.
This report is produced by Dolphin Research, and the copyright belongs solely to Dolphin Research. Without the prior written consent of Dolphin Research, no institution or individual may (i) produce, copy, reproduce, reprint, forward, or otherwise create any form of photocopy or reproduction by any means, and/or (ii) directly or indirectly redistribute or transfer it to other unauthorized persons. Dolphin Research reserves all related rights.
-
Privacy Disputes, Experience Bottlenecks, and Commercialization Confusion: Has the AI Glasses Industry Still Not Escaped the Novelty Trap?
-
Apple's Q3 Was a Warm-Up: The iPhone 18 Pro Plays It Safe While the iPhone Duo Steals the Show
-
![]()
Daoming Optics Q3 Report: Net Profit Plunges 56.54% YoY
-
![]()
$115 Billion Bet on Light Sources: Why Marvell Had to Buy
-
Farewell to Half-Baked Products: AI Apps Finally "Fly Into Ordinary Homes"
-
![]()
Quarterly Report | China's Smart Projector Sales Fell 26% in Q3 2026, Full-Year Forecast Lowered to Below 4 Million Units
-
![]()
NVIDIA, Google, and Intel Make Their Moves in Succession as Physical AI Sparks an Infrastructure Battle
-
NXP to Adjust Prices for Select Chips as Automotive Business Returns to Growth