The Finale of the AI Race: Does Electricity Hold the Key?
 02/10 2026
 525
525
In 2025, the narrative logic of AI will take a sharp turn: With the full deployment of NVIDIA's Blackwell architecture and subsequent higher-power computing clusters, the energy consumption density of data centers will skyrocket exponentially. Goldman Sachs predicts that by 2027, the power density of a single AI server rack will be 50 times that of an ordinary cloud server five years earlier.
This exponential leap in power consumption is crashing headlong into a 'North American hard wall' made of concrete, steel, and aging copper wires:
On one side of the wall lies the insatiable demand for teraflops of floating-point operations per second; on the other, an infrastructure quagmire with an average grid age exceeding 40 years, a transformer shortage rate as high as 30%, and expansion cycles lasting 5-10 years.
Therefore, Dolphin Research focuses on understanding the key aspects of the North American power shortage:
1) Is the power shortage a short- to medium-term supply-demand gap or a long-term structural issue?
2) How can the power shortage be resolved, and what investment opportunities in specific sectors does this resolution entail?
This article primarily explores the first question, focusing on understanding how a highly mature country can find itself without adequate power.
I. U.S. Electricity Demand: A New Upturn Driven by Manufacturing Reshoring and AI Computing Power Surge
By the end of 2025, the capacity auction price in PJM, the largest regional grid in the U.S., soared from $28.92/MW-day to $269.92/MW-day. This ninefold jump signals a market pricing shift from 'risk premium' to 'survival panic.'
The explosive growth in gas turbine orders and the aggressive capacity expansions by Caterpillar and Mitsubishi Heavy Industries essentially reflect tech giants' efforts to 'go off-grid for self-preservation,' attempting to bypass the paralyzed public grid with self-generated power.
Microsoft CEO Nadella stated bluntly: 'Power supply capacity is the biggest bottleneck, even more so than chips.' Huang Renxun concluded: 'It is the availability of electricity, not GPUs, that will determine the scale and speed of AI expansion.' Thus, the decisive factor in the AI race has officially shifted from chips to power plants.
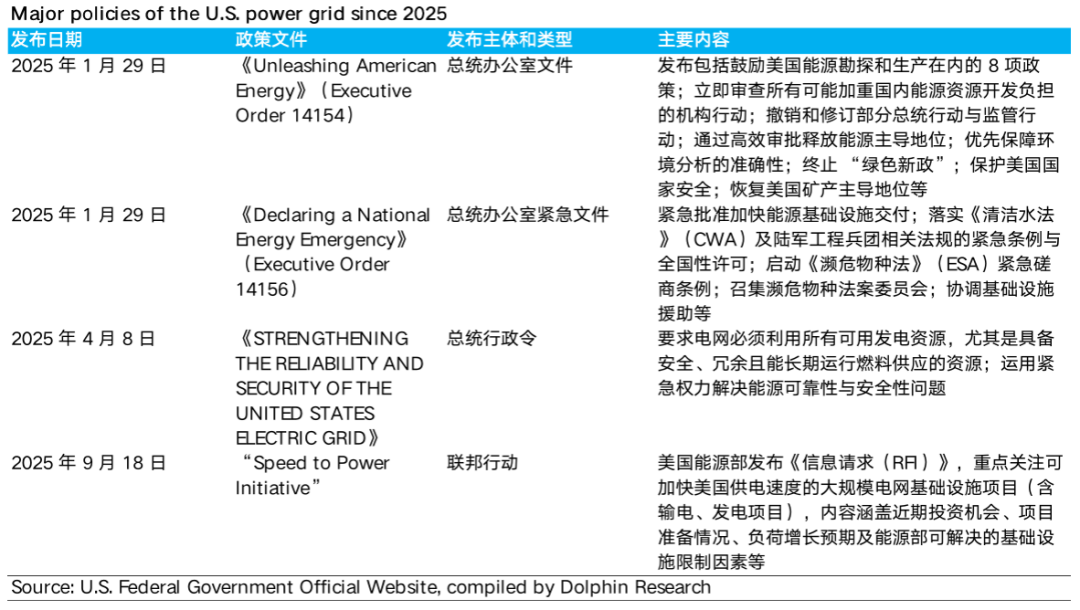
Faced with the threat of energy gaps to national competitiveness, the U.S. federal government activated an unprecedented 'wartime mode' in 2025:
In January, the White House declared an 'energy emergency' in peacetime, elevating power security to a national security priority.
In April, grids were mandated to utilize all available energy sources, with 'decarbonization ideals' temporarily giving way to 'computing power survival,' as coal and gas power were thrust back to the forefront.
In September, the Department of Energy (DOE) launched the 'Power Acceleration Plan,' using administrative power to shorten approval cycles for large grid projects.
Standing at the 2026 milestone, the AI revolution has spread to traditional industries, evolving into a full-industry-chain restructuring involving upstream energy, power equipment, and grid flexibility upgrades. Next, we focus on understanding the changes in electricity demand.
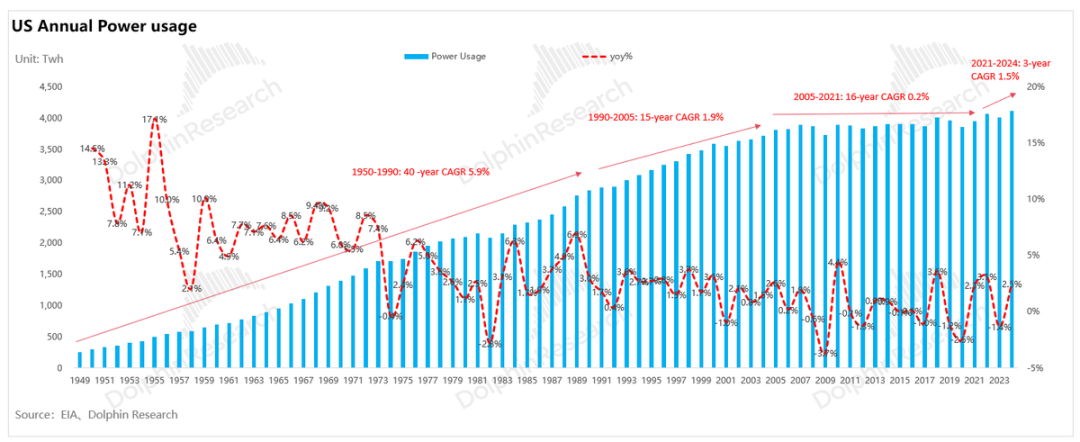
Throughout U.S. power development history, end-use electricity demand has exhibited a distinct three-stage evolution: 'growth-plateau-recovery'":"Rapid Growth Period (1950s-1990s): Driven by post-war economic prosperity, heavy industrialization, and residential electrification (e.g., air conditioners and home appliances), U.S. electricity load maintained high growth (CAGR of 6%).
Plateau Period (1990s-2020s): Affected by the dot-com bubble burst and the 2008 financial crisis, economic growth slowed, coupled with industrial restructuring (shift from heavy manufacturing to light services) and energy-saving technology adoption. Total electricity consumption oscillated within a range for 15 years with virtually no growth.
Recovery Growth Period (2021-present): U.S. electricity demand has reached a historic inflection point. Policymaking, with the Biden administration's IRA Act and CHIPS Act providing substantial subsidies, combined with Trump's manufacturing reshoring policies, has formed a synergistic force driving the 'reindustrialization' strategy and strongly propelling manufacturing reshoring. Industrially, the explosive construction of AI data centers has brought massive new energy consumption.
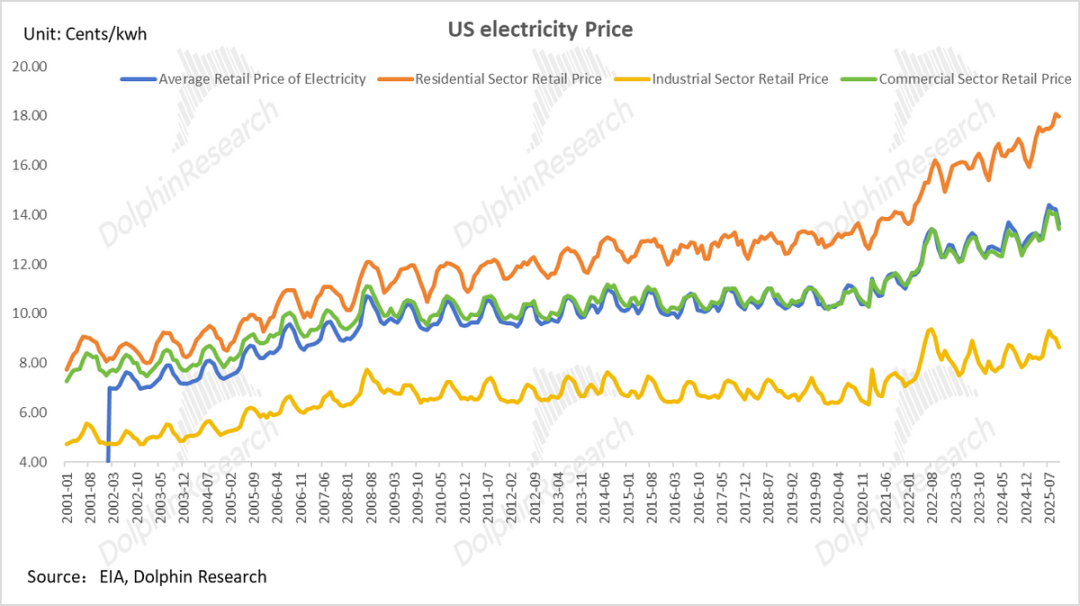
Together, these factors have returned U.S. electricity demand to a growth trajectory, with average annual growth reaching around 1.5% from 2021-2024 and electricity prices accelerating upward since 2022.
Meanwhile, from the perspective of electricity consumption structure:
Commercial electricity use is the core engine of growth, with data centers being the absolute mainstay. By the end of 2024, the load from U.S. data centers had reached approximately 35 GW, doubling from 2020.
Industrial electricity use is also synchronously recovering, with the reshoring of high-end manufacturing such as semiconductor wafer fabs and power battery factories providing solid bottom-line support.
Core Contradiction: The Challenge from 'Total Electricity Consumption' to 'Peak Load'
According to NERC data, the peak load of the U.S. grid (electricity load × usage time = electricity consumption) has stagnated since peaking in 2006, leading to prolonged slow expansionary capital expenditures on the grid side (first exceeding $30 billion in 2024). The North American grid is severely aging, with an average service life approaching 40 years.
The rise of AI data centers has completely transformed the electricity consumption landscape: As a new type of rigid load with 'ultra-high power density' and 'nearly 24-hour full-load operation' during training, they lack the regulatory flexibility of traditional industrial loads (difficulty in participating in peak shaving).
Once the growth rate of 'peak load' on the demand side exceeds the construction speed of 'effective capacity' on the supply side, a 'capacity gap' becomes inevitable, triggering the North American power shortage crisis and bringing risks of rising electricity price levels and large-scale blackouts.
Therefore, we first focus on estimating the incremental North American electricity load from 2025-2030:
① AI Data Centers: The Core Driver of Load Explosion
We can dissect the new peak load and core driving factors brought by AI through a 'bottom-up' model:
a. New data center connected capacity (GW) = GPU shipments × single-chip TDP × system power consumption coefficient × PUE
TDP: Thermal design power of a single chip;
System power consumption coefficient: Represents the energy consumption of components necessary to maintain server operation beyond the core GPU (CPU/memory/networking/power losses, etc.), typically ranging from 1.3-1.5.
PUE (Power Usage Effectiveness): The ratio of 'total data center energy consumption / IT equipment energy consumption.' It represents the additional power cost for 'environmental maintenance' (cooling, power distribution, lighting, etc.) and is a core indicator for measuring data center energy efficiency.
b. New data center peak load ≈ new connected capacity × peak demand coefficient.
The peak demand coefficient measures the actual grid capacity occupancy rate of data centers during operation (i.e., actual maximum load / total rated equipment power).
Based on this logic, we further review the core incremental changes in the North American market:
a. Core Driver: Explosive Growth in North American CSP Capital Expenditures
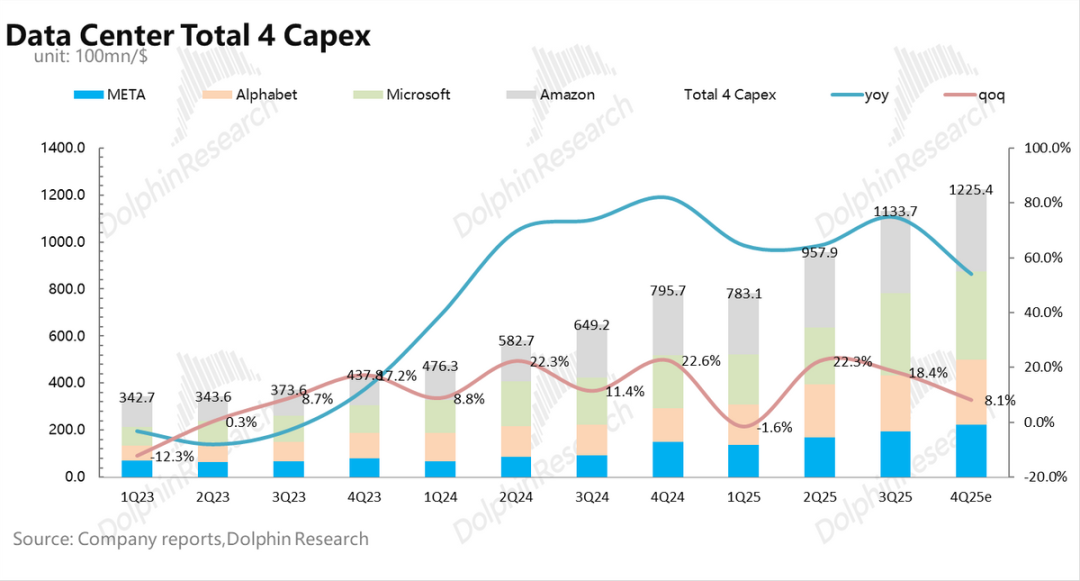
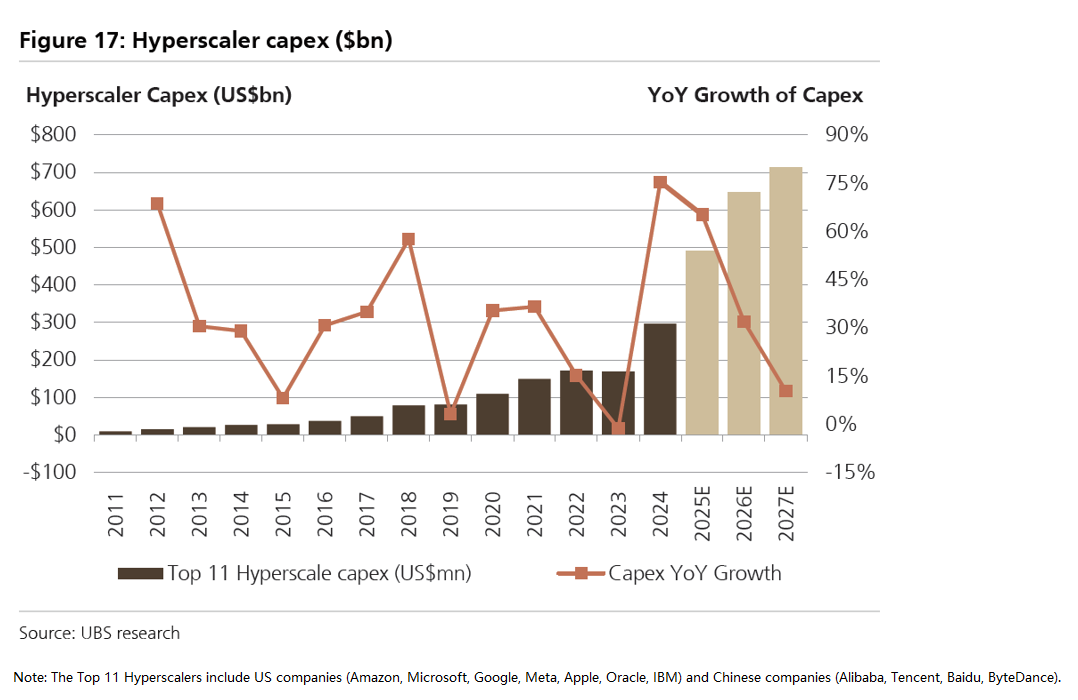
Global data centers are undergoing a historic expansion cycle driven by generative AI: From the perspective of construction entities, the absolute main force in global data center expansion is North American cloud computing giants (CSPs).
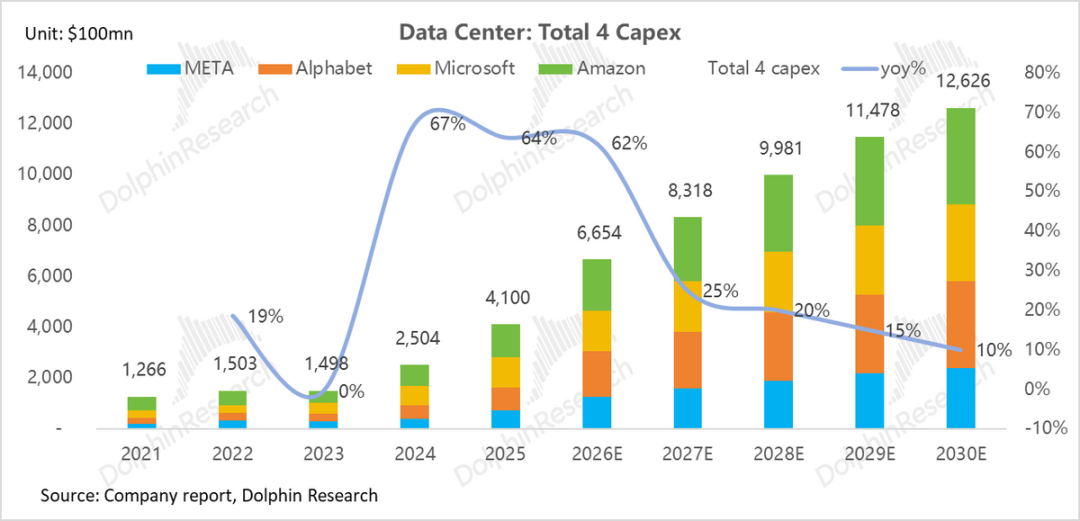
Represented by Amazon, Microsoft, Google, and Meta, the capital expenditures of the four major North American CSPs have entered a 'arms race' mode since H2 2023. Their total CapEx has surged from approximately $150 billion in 2023 to an estimated $406 billion in 2025 (CAGR exceeding 60%).
Meanwhile, although Chinese internet giants (BAT + ByteDance) are limited by chip supply and have a smaller investment scale compared to U.S. giants (estimated at approximately $60 billion in 2025), they still constitute another important growth pole in global AI infrastructure.
Driven by these two camps, the combined capital expenditures of the world's top 11 tech giants will accelerate from $180 billion in 2023 to nearly $500 billion in 2025. This 'arms race' directly drives the continuous explosion in upstream AI chip shipments and data center scale.
b. Data Center Computing Power 'Brutal Aesthetics': Computing Power = Electricity
As Moore's Law slows, AI chips have entered an era where 'high computing power' drives 'high energy consumption':
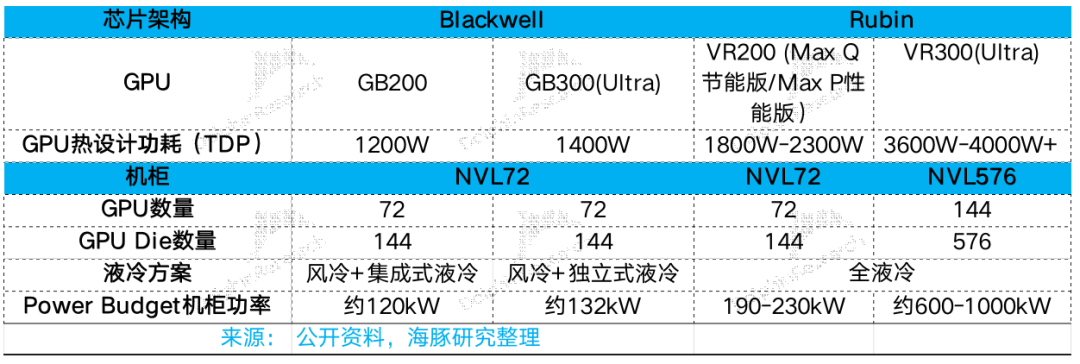
Spike in single-point thermal density: NVIDIA's GPU single-chip TDP has jumped from 700W in the H100 era to the 1200W-1400W range with the Blackwell architecture (GB200/GB300). Market expectations for the next-generation Rubin architecture and its matching (super chip platform) anticipate power consumption will further exceed 2000W, placing extreme demands on power supply and cooling capabilities.
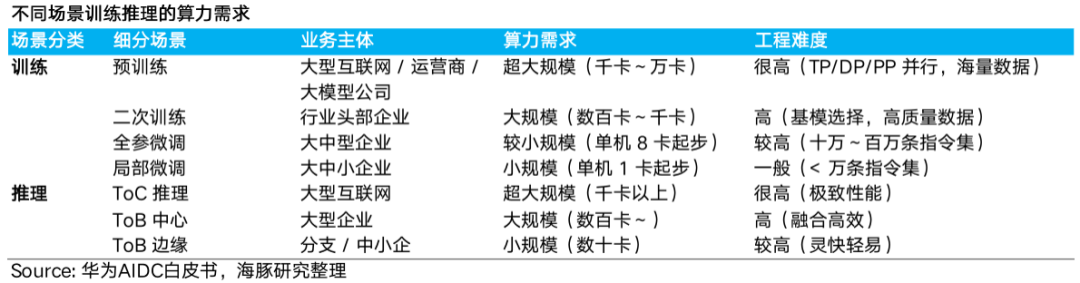
Exponential expansion of cluster scale: The training and inference demands of AI large models are driving the deployment scale of individual data centers from the 'thousand-card level' to the 'hundred-thousand-card level.'
For example, the 'Stargate' project planned by OpenAI and Oracle in Texas is expected to deploy over 450,000 GB200 chips, with a total electricity load potentially exceeding 1.2 GW (equivalent to the electricity consumption of a medium-sized city), posing a massive challenge to both the energy and grid sides.
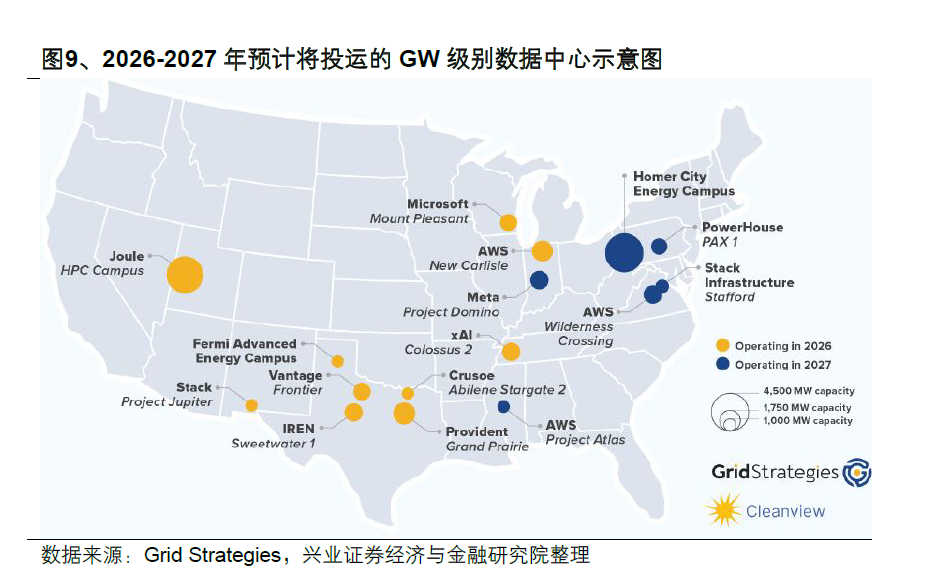
According to Grid Strategies, 10 GW-scale data centers are expected to be operational by 2026; among data centers planned for completion by 2030, approximately 50% will reach GW-scale.
c. AI Data Centers: From 'Tidal Fluctuations' to 'Rigid Full Load'
Traditional data centers (dispatchable flexible loads): Their business primarily involves cloud computing, data storage, and network services, exhibiting a pronounced 'tidal effect' (busy during the day, idle at night).
Service providers achieve 'peak shaving and multiplexing' among multiple tenants through virtualization technologies and overselling strategies. This results in a relatively flat overall load curve, with peak load rates typically controlled below 60%, providing ample regulatory and buffer space for the grid side.
AI data centers (rigid impact loads): With the explosion in AI training demands, data centers are transforming into 'rigid industrial loads' that must be prioritized for grid security:
Macroscopically, they are 'behemoths' reshaping regional power baseloads: AI training clusters pursue ultimate parallel efficiency, and once activated, they operate near full capacity for weeks or even months (peak load rate >90%), presenting a high, straight-line load profile.
The landing of a single GW-scale project is equivalent to instantly adding the energy consumption of a medium-sized city, instantly filling the transmission margins of regional grids and subjecting subsequent grid connections to years-long queuing and expansion bottlenecks.
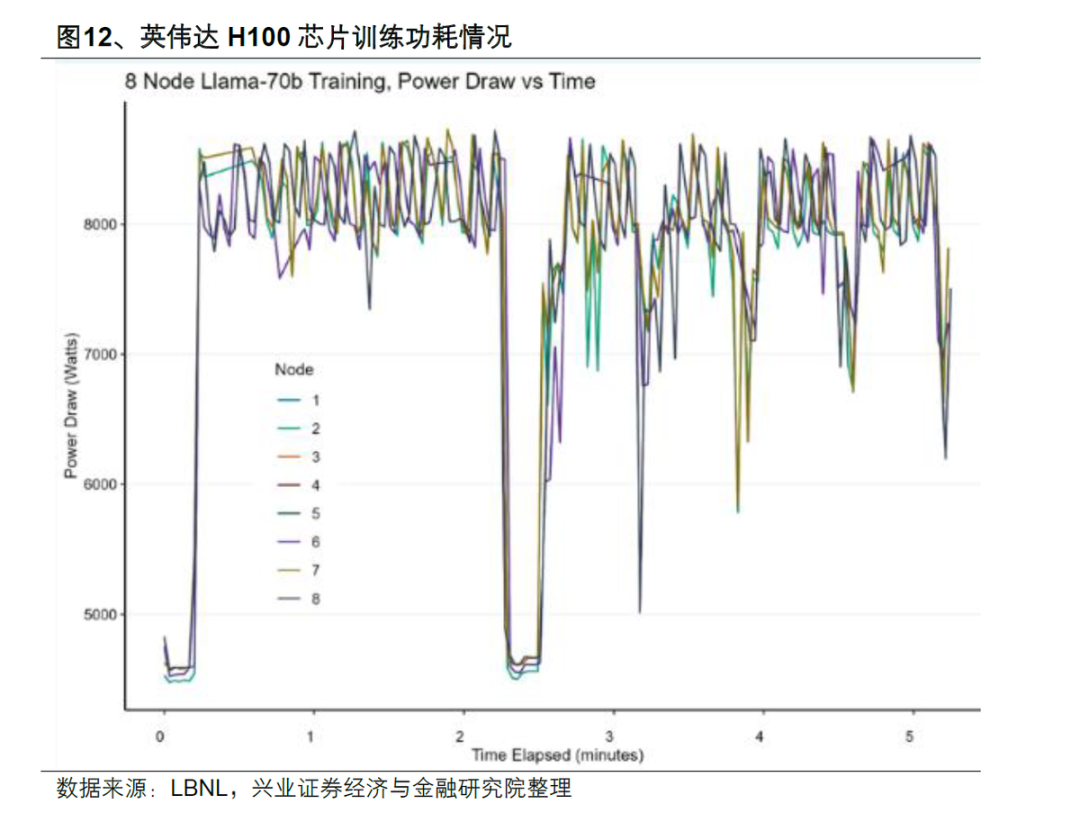
Microscopically, they are 'millisecond assassins' attacking the heart of the power system: Due to the high synchronization of GPU tasks, when clusters switch from 'computation' to 'communication' or from 'idle' to 'full load,' they generate sharp power jumps within microsecond/millisecond time windows.
NERC revealed that the load of a large data center once dropped sharply from 450 MW to 7 MW within 36 seconds (equivalent to instantly cutting off a medium-sized power plant). This extremely high current change rate acts as a 'power sledgehammer,' frequently impacting the already aging U.S. grid.
Such severe fluctuations are enough to trigger voltage flicker, harmonic pollution, and even trigger relay protection, leading to regional power outages. Therefore, deploying SVG/super capacitors, or energy storage systems, has become an essential shield to smooth this 'electric power sledgehammer'.
Regarding the capacity of newly added data centers in the United States, Dolphin Research provides several estimation approaches as references:
a. Estimation based on data centers under construction and in planning:
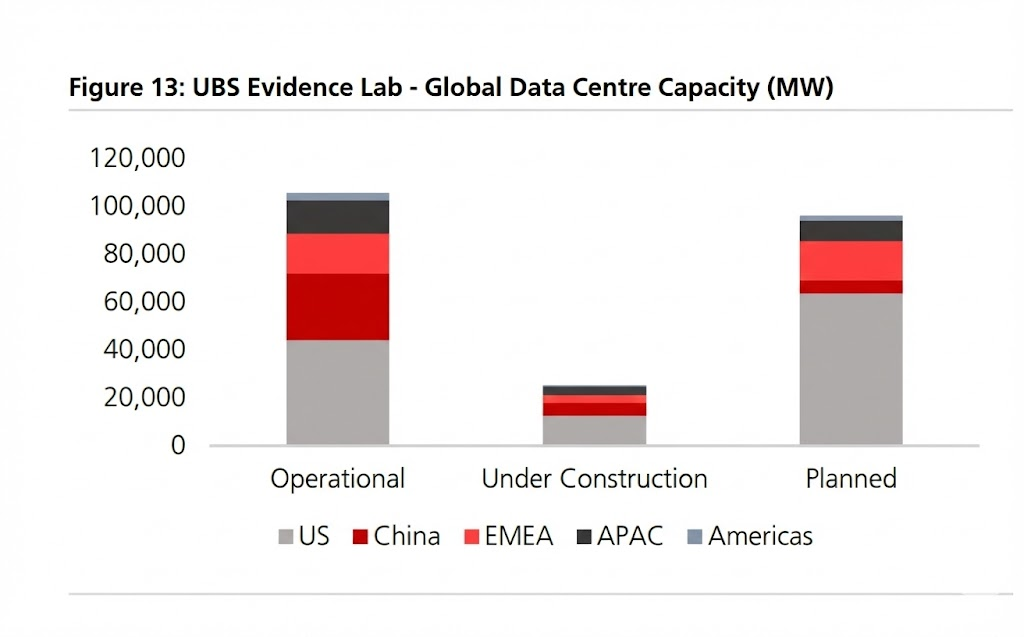
According to UBS data, by the end of 2025, the global operational capacity of data centers will be 105 GW, with 25 GW under construction and over 100 GW in the planning phase.
In the absence of external bottlenecks such as electricity and land constraints, the complete construction cycle of an AI data center, from planning and civil engineering to IT equipment deployment, typically takes around 18-24 months. New entrants like Coreweave can shorten the construction cycle to 12-18 months by obtaining NVIDIA GPUs faster and adopting modular and prefabricated construction methods.
Assuming that the aforementioned 125 GW of reserve capacity is fully operational by 2030 and no additional planned capacity is added, the global data center capacity will increase by 125 GW over the next five years (2026-2030), reaching 225 GW by 2030, with a five-year compound annual growth rate (CAGR) of approximately 16%.
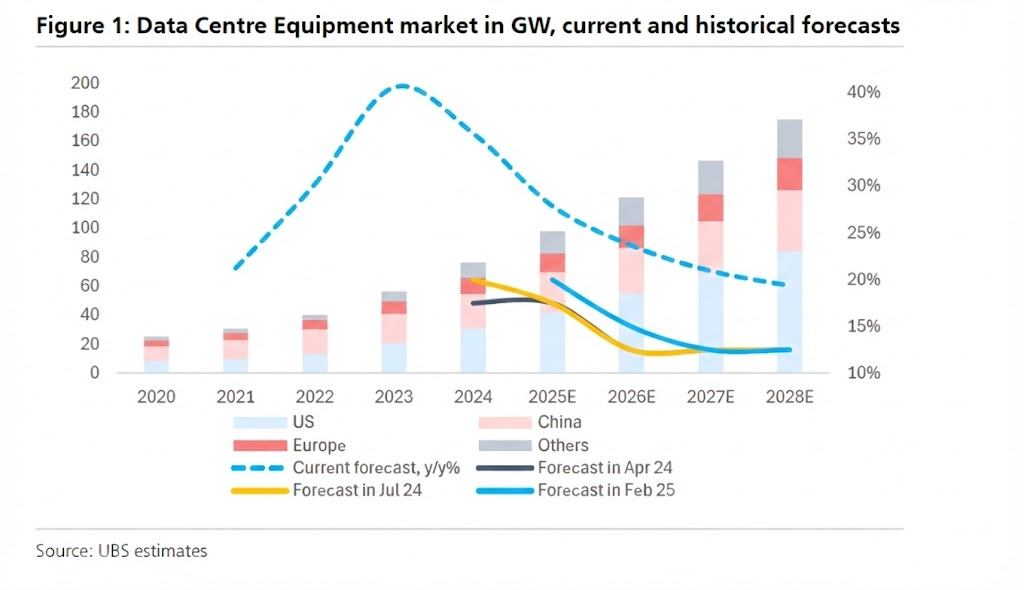
From the perspective of the dominant United States, by the end of 2025, the operational data center capacity in the U.S. will be 44 GW, with 10 GW under construction and approximately 70 GW in the planning phase.
Based on the same assumption, between 2026 and 2030, the U.S. data center capacity will release 80 GW of new capacity (accounting for 64% of the global increase), bringing the total capacity to 124 GW, with a CAGR as high as 23%.
Considering that AI data centers have high concurrency and high-load characteristics, if we assume that 100% of the new capacity is converted into peak load, this means that the U.S. power grid will face an additional peak load impact of 80 GW over the next five years.
b. Estimation from the perspective of capital expenditure:
According to Jensen Huang, the construction cost of a 1 GW data center capacity is approximately USD 50-60 billion (including approximately USD 35 billion for the chip system). Dolphin Research takes the median value of USD 55 billion/GW (assuming all data centers use NVIDIA chips).
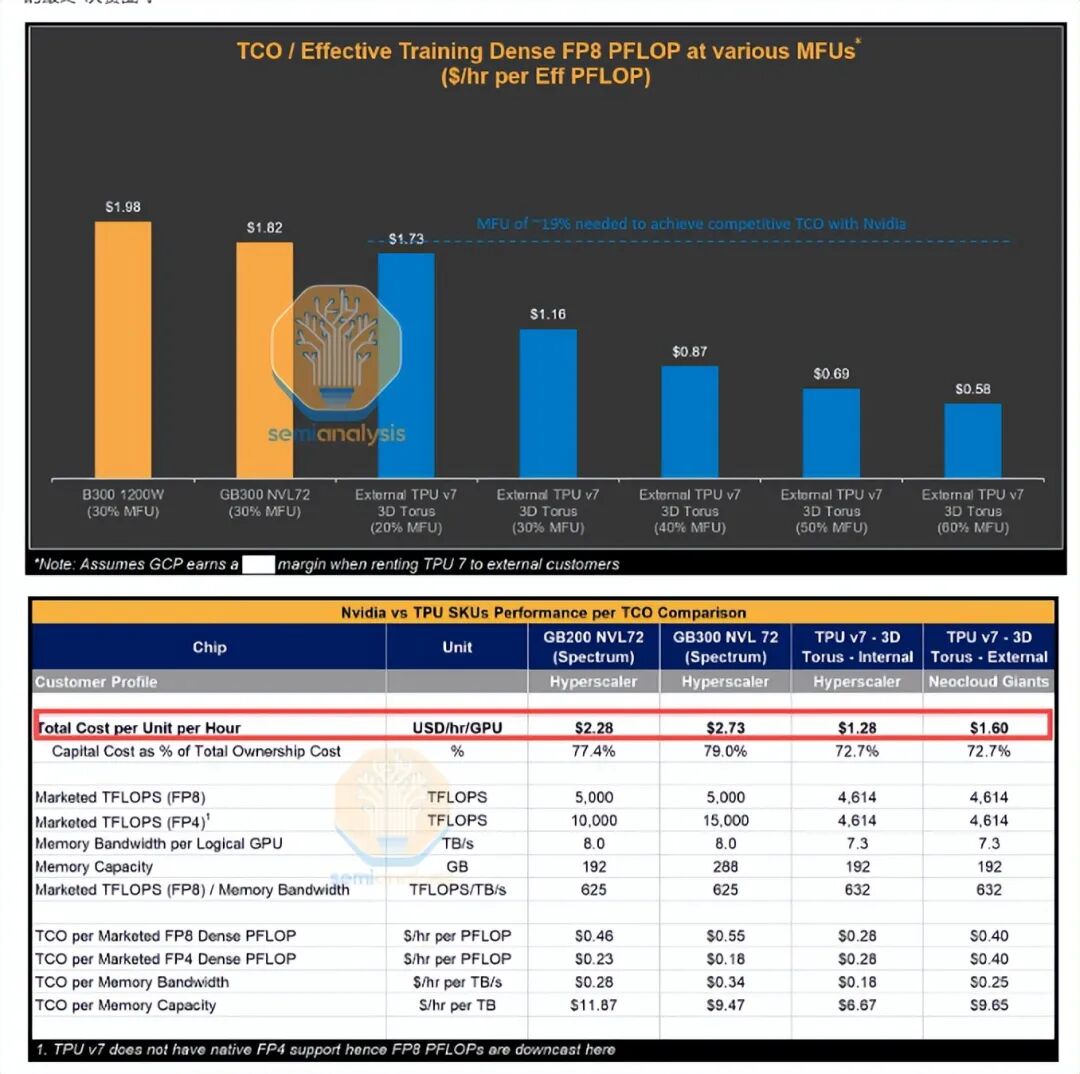
However, with the penetration of self-developed chips such as Google TPU in inference and specific training scenarios, costs will significantly decrease. TPU V7 not only has a 41% lower total cost of ownership (TCO) per unit of computing power than GB300 but also has advantages in energy consumption and cooling, which are expected to reduce its capital expenditure (Capex) to half of that of GPU solutions (approximately USD 27.5 billion/GW).
If we calculate based on an average hybrid architecture of '65% GPU + 35% TPU' for data centers over the next five years, the weighted construction cost per GW will drop to USD 45.4 billion. Assuming an additional capacity of 80-120 GW for data centers over the next five years, the average annual AI investment will reach USD 700 billion to USD 1 trillion.
If AI data center-related expenditures account for 80%-90%, this means that the average annual total capital expenditure of cloud service providers (CSPs) will reach USD 900 billion to USD 1.2 trillion between 2026 and 2030 (approximately USD 650-700 billion in 2026), which is basically in line with the current high-growth expectations of the industry chain (a five-year CAGR of approximately 25% from 2026 to 2030).
c. Supply-side validation based on FERC regulatory data:
The U.S. Federal Energy Regulatory Commission (FERC) requires all electric utilities to submit annual filings to monitor the generating capacity, power exchange volumes, and peak load forecasts in each planning region. This is the most fundamental 'ledger' for grid planning across the United States.
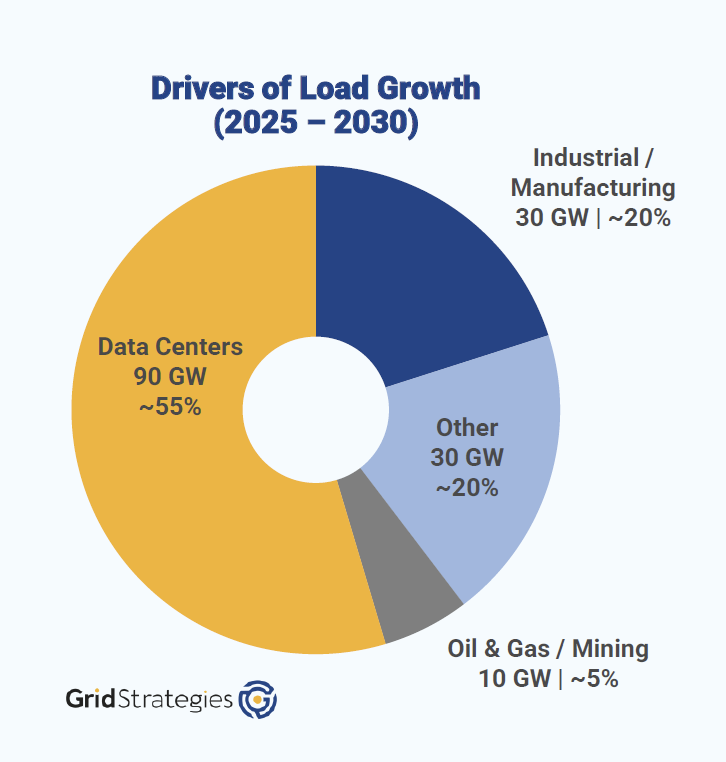
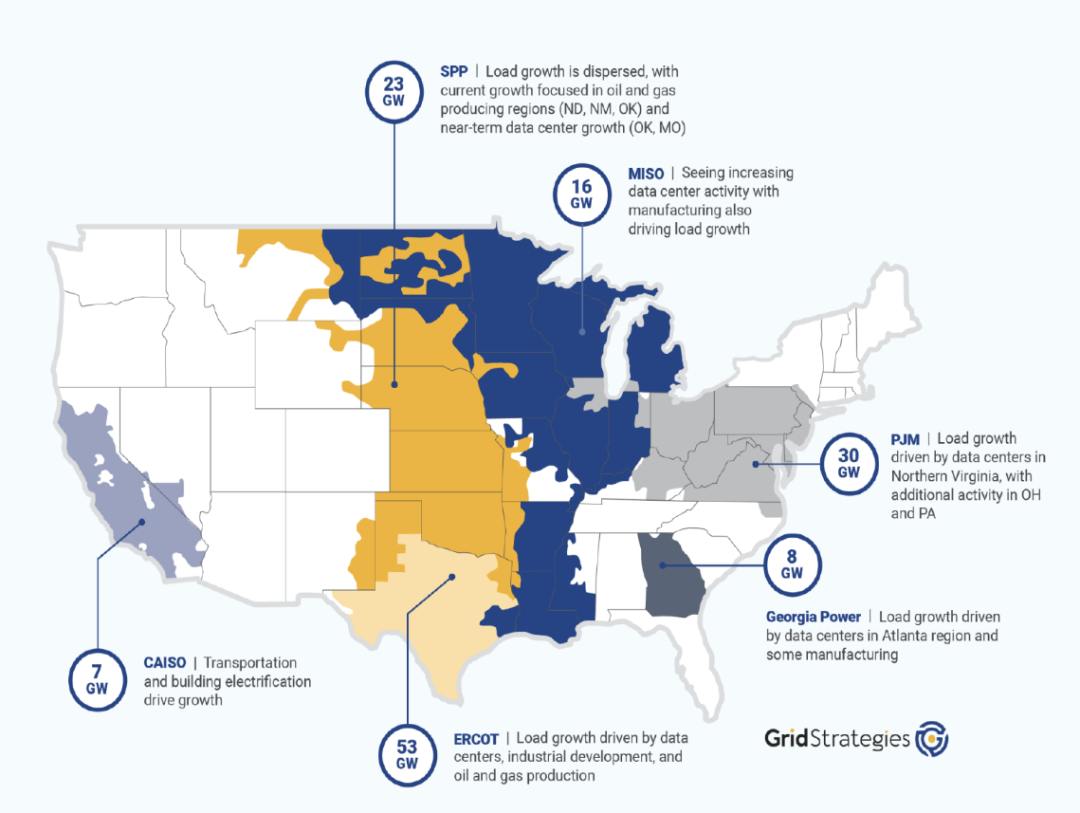
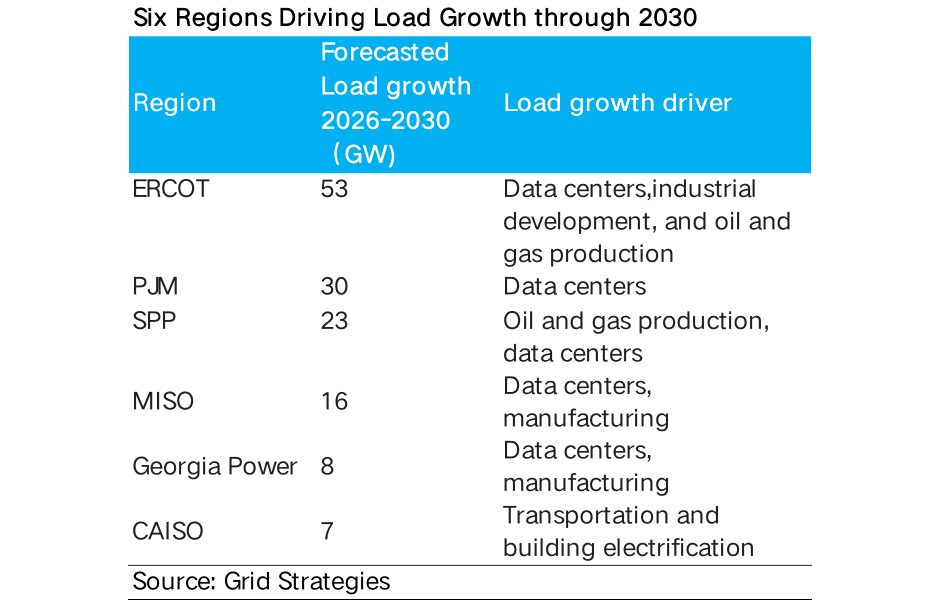
North American electric utilities have significantly raised their peak load expectations for the next five years, with a total planned increase of up to 166 GW. In this 'super cycle' of electricity demand, data centers are the absolute dominant force:
a. Data centers are expected to contribute 90 GW of load increase;
b. Followed by industrial/manufacturing reshoring (an additional 30 GW) and end-use electrification (an additional approximately 30 GW, primarily driven by residential electrification—such as heating heat pumps and electric vehicle facilities);
c. The remaining increase comes from the oil and gas mining industry (an additional 10 GW).
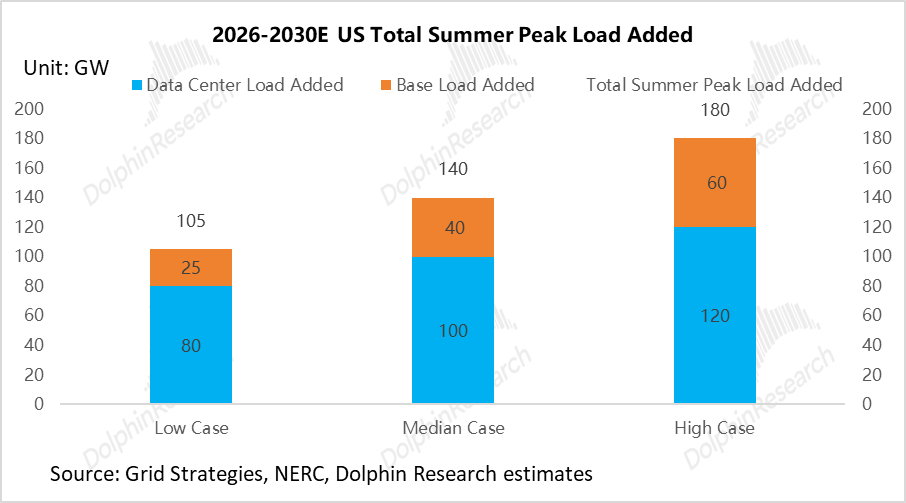
Therefore, based on the above estimations, Dolphin Research makes the following predictions for North American electricity demand over the next five years:
① AI data centers: We assign new load expectations of 80 GW / 100 GW / 120 GW (pessimistic/neutral/optimistic).
However, Dolphin Research needs to point out that our 'optimistic scenario' may still be conservative compared to the grand blueprints of tech giants. Taking OpenAI as an example, its planned computing infrastructure capacity for 2033 is as high as 250 GW, which means that the ceiling for AI energy consumption may be far from being reached.
② Base load: Although FERC predicts that the new load driven by end-use electrification and manufacturing reshoring will be as high as 76 GW, considering the slowdown in electric vehicle adoption in the United States and the complexity of actual manufacturing reshoring, Dolphin Research predicts that the base load increase over the next five years will be 25 GW / 40 GW / 60 GW (corresponding to a CAGR of 0.6%-1.5%).
Total peak increase: Combining the above two drivers, Dolphin Research assigns expectations of total new peak load increases in the North American market over the next five years of 105 GW / 140 GW / 180 GW under pessimistic/neutral/optimistic assumptions (corresponding to a CAGR of 2.4%/3.2%/4%).
II. Supply Side: The United States Faces Dual Bottlenecks in Energy and Grid Equipment
2.1 Energy Side (Power Generation Side): Significant Retirement of Effective Energy Sources and Insufficient Reliable Replacements
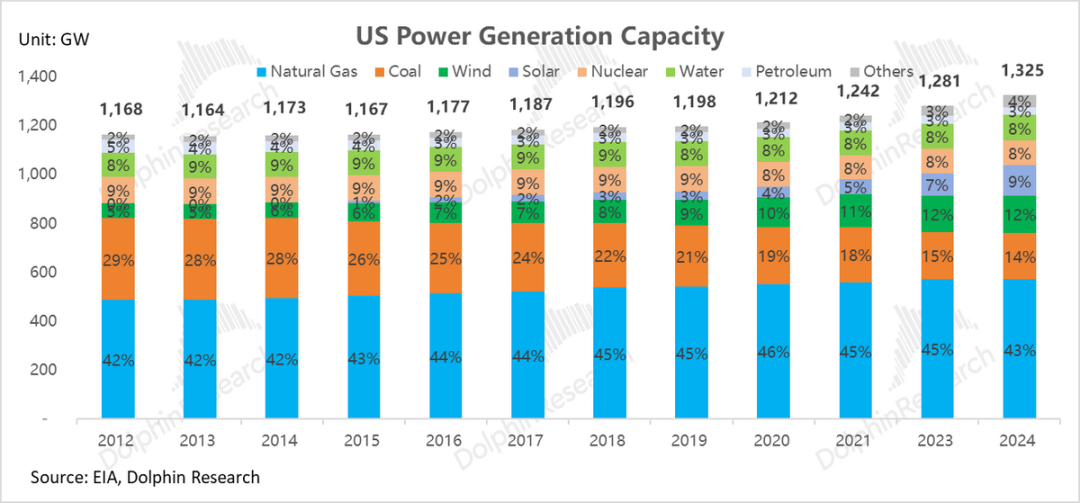
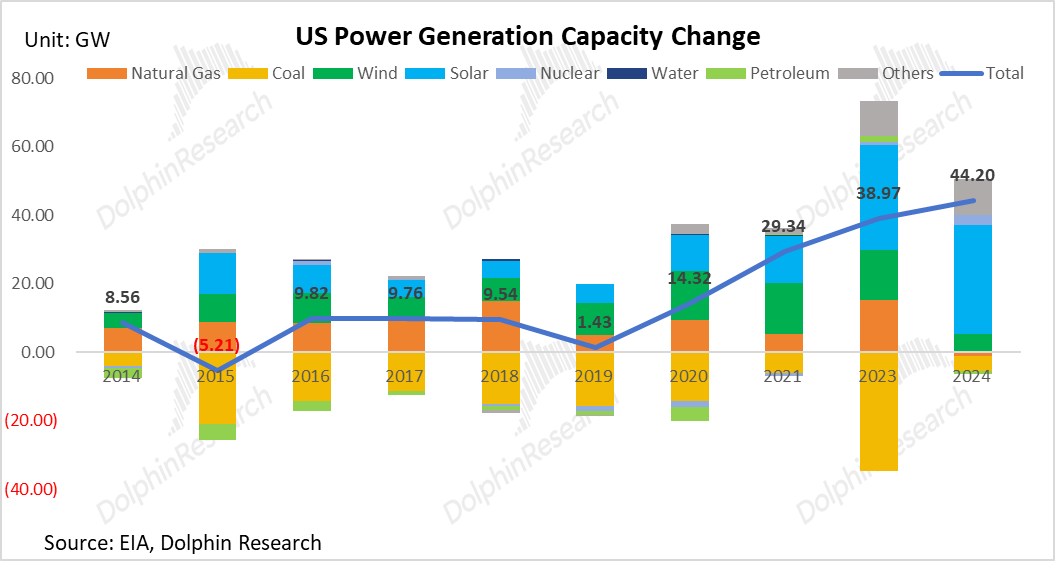
Over the past decade (2014-2024), while the total capacity of the U.S. power system has shown only a slight increase (with a CAGR of just 1.2%), there has been a dramatic shift in the power generation mix, laying the groundwork for the current electricity shortage crisis on the supply side:
① Accelerated 'Blood Loss' of Highly Reliable Base Load Sources
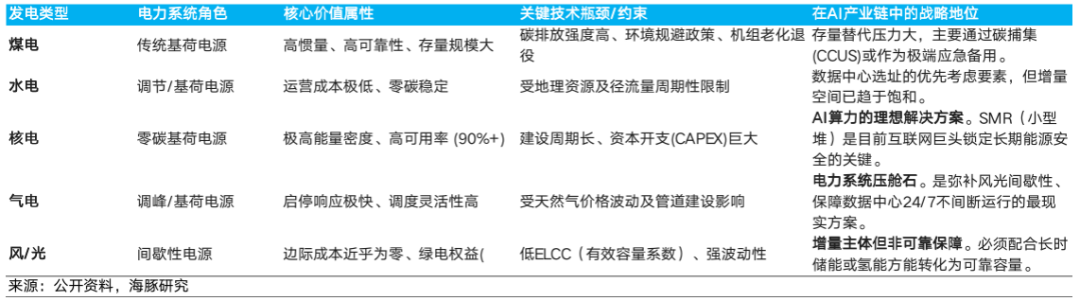
Accelerated retirement of coal-fired power: For a long time, coal-fired power has been under dual pressure from environmental policies and the cost advantage of natural gas, leading to its accelerated retirement. Its installed capacity has nearly halved (from 318 GW in 2011 to 174 GW in 2024), and its share in power generation has shrunk from 30% to 14%, weakening the system's basic guarantee (guarantee) capabilities.
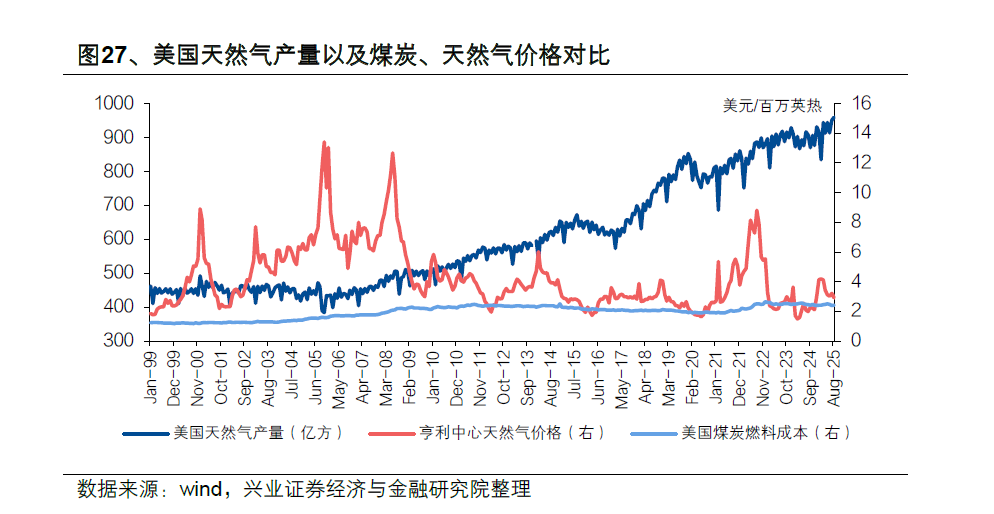
Natural gas shifting from peaking energy to a 'ballast stone': Thanks to the cost advantages brought by the U.S. shale gas revolution and its scheduling flexibility, as well as its relatively better cleanliness compared to coal-fired power, the installed capacity of natural gas power generation has steadily increased, and its share has remained stable at over 40% for a long time, making it the main power source.
However, overall, by 2025, the total installed capacity of traditional dispatchable and highly reliable base load sources such as 'thermal, hydro, and nuclear' will still have decreased by 77 GW compared to 2011, continuously weakening the foundation of system reliability.
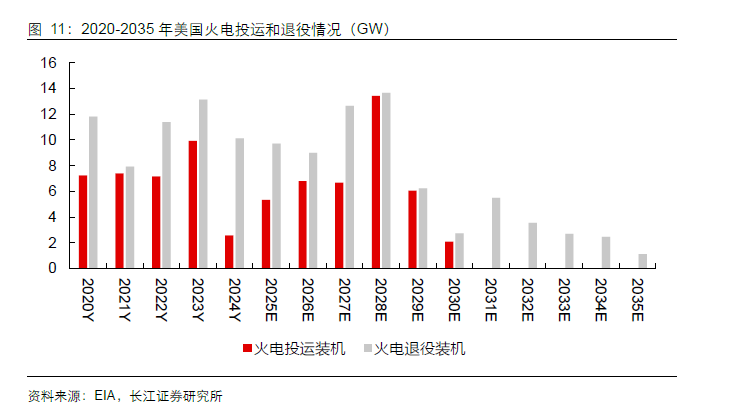
'Aging' Crisis: 528 GW (accounting for over 50%) of high-quality base load sources (thermal, hydro, and nuclear) have been in service for more than 30 years, leading the United States to enter a peak period of thermal power retirement since 2010. More severely, according to EIA forecasts, from 2020 to 2030, the retirement volume of base load units will exceed their new additions every year, meaning that before the AI demand explosion, the system's 'reliable capacity' has been continuously net losing.
② Mismatch in Incremental Additions: 'Electricity Volume Replacement' by Wind and Solar Cannot Fill the 'Capacity Gap'
The gap left by coal-fired power is not being filled by equally reliable base load sources but by intermittent energy sources such as wind and solar power.
Between 2011 and 2024, their installed capacity surged more than 5.5 times from less than 50 GW to 329 GW, contributing 121% of the net increase in installed capacity during the same period and achieving electricity volume replacement for coal-fired power in terms of power generation.
However, this 'replacement' is only in terms of 'electricity volume,' not 'capacity.' That is, while they generate a large amount of cheap electricity during favorable weather conditions, it does not mean they can produce effective electricity during peak demand periods when the grid needs it most.
③ Fundamental Conflict Between Fluctuating Power Sources and AI's Rigid Demand
The current situation of 'loss of highly reliable base load sources but replacement with highly fluctuating energy sources' is also the structural root cause of the current electricity crisis, as it mismatches with AI's electricity demand:
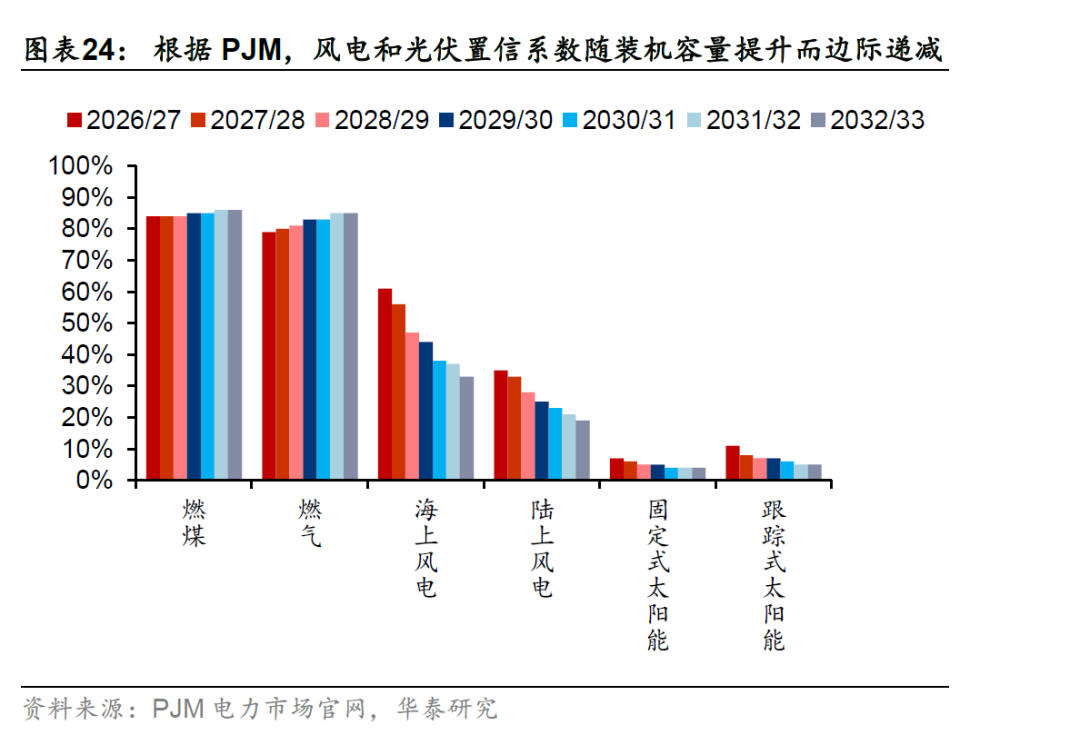
a. 'Discounting' of effective capacity of wind and solar: In grid planning, the effective capacity coefficients of wind and solar are extremely low—solar power is only 10-20%, and wind power is 30-40%, while base load sources such as coal-fired, gas-fired, and nuclear power generally have coefficients of 80-90%. This is due to the intermittency and volatility of wind and solar, making their reliability contributions far inferior to those of stable base load sources.
b. The more wind and solar installed, the less reliable: The more wind and solar power plants are installed in the same region, the more their effective load-carrying capability (ELCC) shows 'diminishing marginal returns,' meaning that the ability of new installations to guarantee (guarantee) the system's peak load becomes weaker and weaker.
c. Mismatch between physical characteristics and AI's rigid load: AI data centers represent high-density, high-load-factor rigid loads that require a stable 24/7 power supply.
However, the main newly added power sources (wind and solar) are intermittent, volatile, and uncontrollable. Moreover, limited by the fragile cross-regional grid interconnection in the United States, the abundant wind power in the Midwest cannot be transmitted in real-time to the AI clusters on the East Coast. This 'spatial mismatch' further exacerbates the supply-demand gap in local areas.
Based on the planning guidelines from the EIA, NERC, and the U.S. Department of Energy, Dolphin Research has made the following forecasts for the new supply of power generation energy over the next five years (2026-2030E):
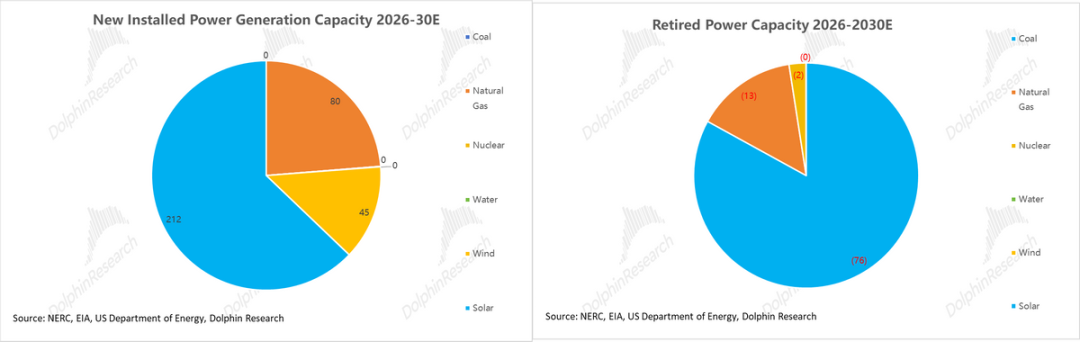
Dolphin Research expects 337GW of new power capacity to be added over the next five years (2026-30E). Among this, intermittent power sources such as photovoltaic and wind power will contribute more than 76% of the increase (approximately 257GW), while the increase in natural gas power generation, which offers stable and dispatchable capacity, will only be 80GW (accounting for about 24%).
However, during the same period, units scheduled for retirement amount to a staggering 92GW, almost all of which are highly reliable baseload power sources (approximately 76GW from coal and 13GW from gas). This means that, in the net addition of 245GW of installed capacity, the net contribution from stable power sources is negligible, leaving the system continuously "hemorrhaging."
Furthermore, due to the significant differences in the reliable output (effective capacity) contributions of different power sources during peak grid demand periods, Dolphin Research has adjusted the aforementioned net increase of 245GW of installed capacity based on effective capacity factors (90%/90%/95%/80%/40%/10% for coal/gas/nuclear/hydro/wind/solar, respectively). The result shows that the new effective net capacity added to the U.S. power system over the next five years will only be about 28GW.
In other words, nearly 90% of the nominal increase in installed capacity cannot be converted into reliable power supply during the most critical peak demand periods on the grid.
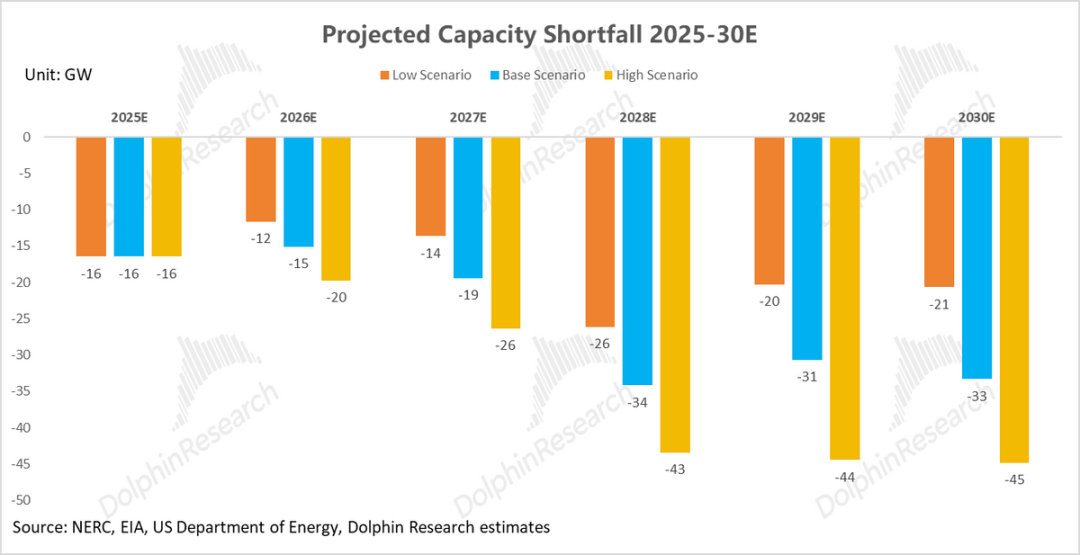
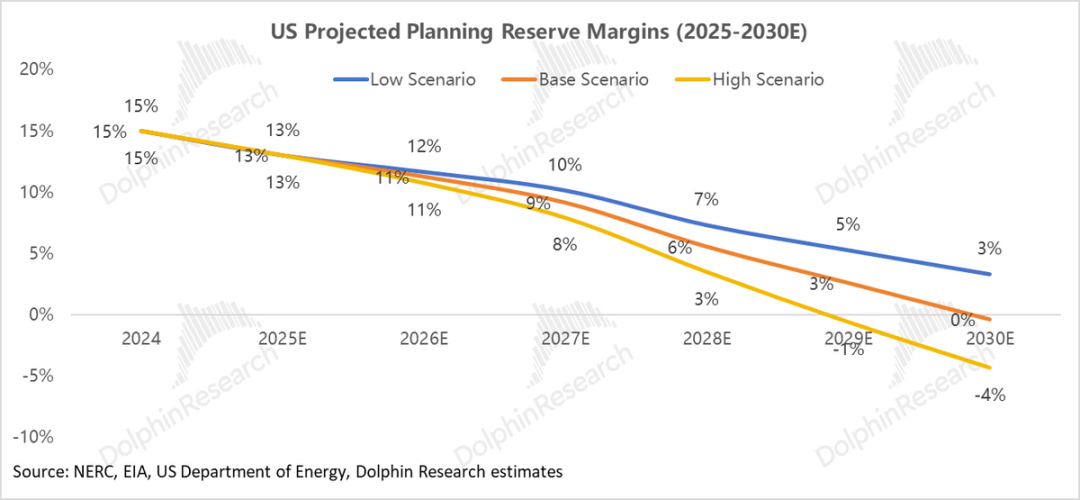
④ Supply-Demand Gap: A Huge and Certain Reliability Shortfall
Assuming the system reserve margin remains the same as in 2024 (15%), and considering the explosive growth in AI-related load on the demand side, Dolphin Research predicts that by 2030, the U.S. power system will face a significant reliability shortfall. The estimated gaps under low, medium, and high-demand scenarios are expected to reach 109GW, 149GW, and 195GW, respectively.
(Note: Reserve margin = (total effective capacity - peak load) / peak load. The industry benchmark is typically set at 15% to ensure that the system has sufficient reliable capacity as a buffer under "worst-case scenarios" such as unit failures, demand forecasting errors, or extreme weather conditions.)
It is evident that the U.S. power system is be caught in (trapped in) a dilemma of "prosperity on paper but weakness in reality":
The nominal capacity of wind and solar installations has grown rapidly, creating the appearance of a "green transition." However, their extremely low and declining effective capacity cannot fill the "reliability gap" left by the retirement of traditional baseload power sources, nor can it support the explosive growth in peak load driven by AI.
This has led to an absolute shortage of reliable capacity in the system, constituting the main cause of the current power shortage crisis.
2.2 Grid-Side (Transmission-Side):
The power shortage crisis in the U.S. is not solely a power generation issue; the transmission side also faces severe challenges: The aging grid infrastructure cannot withstand the impact of AI data centers, which are massive energy consumers:
① Physical Bottleneck – The Aging Grid Cannot Withstand the "Energy Giants"
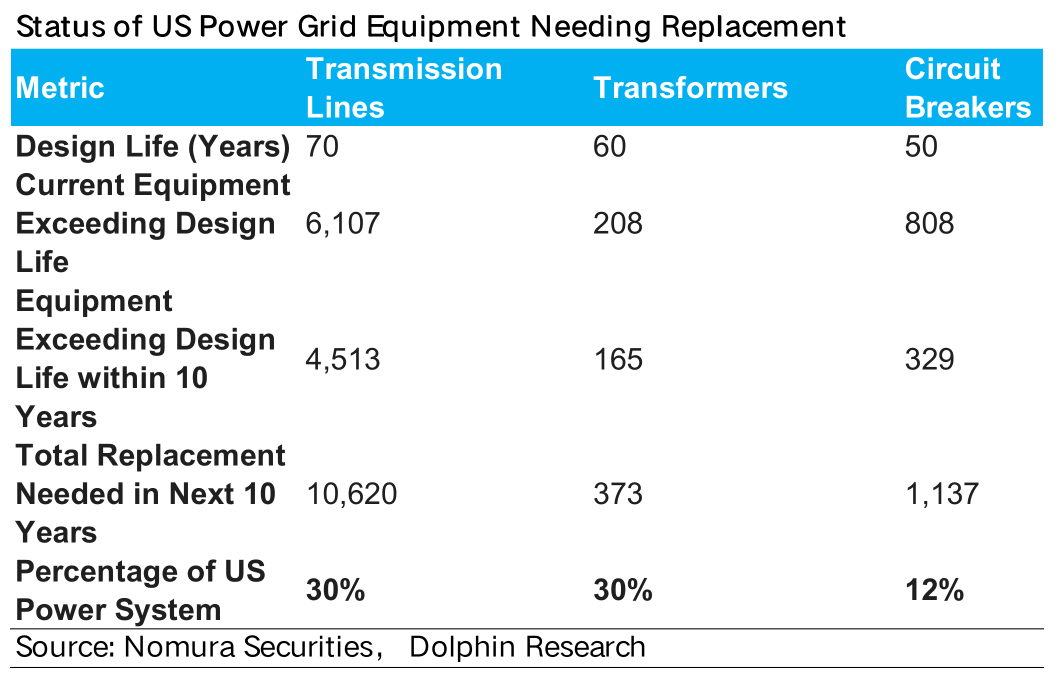
The U.S. grid was built early, with its basic structure taking shape in the mid-20th century. According to the U.S. Department of Energy (DOE), 70% of transmission lines and power transformers have been in operation for more than 35 years, and about 30% of core assets (including circuit breakers) have exceeded their design lifespans, significantly weakening system reliability.
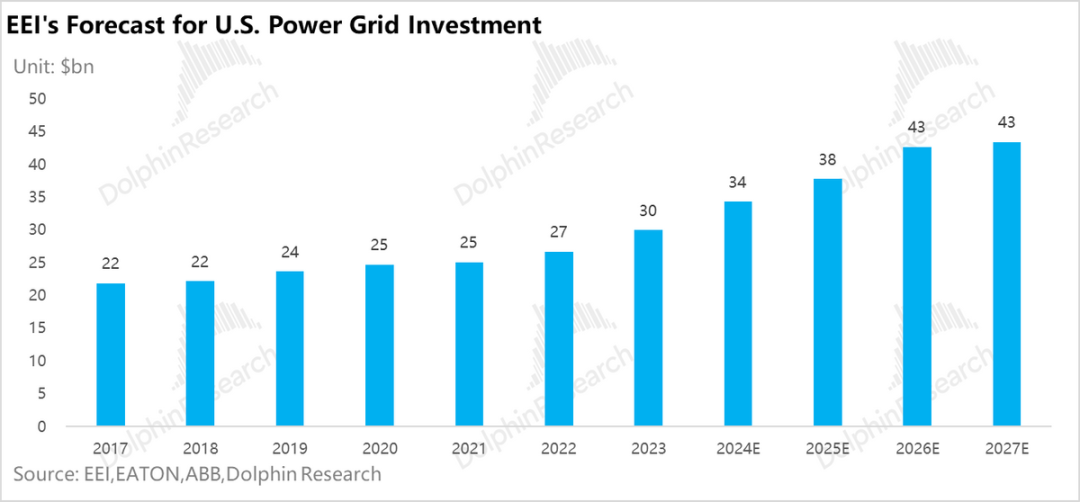
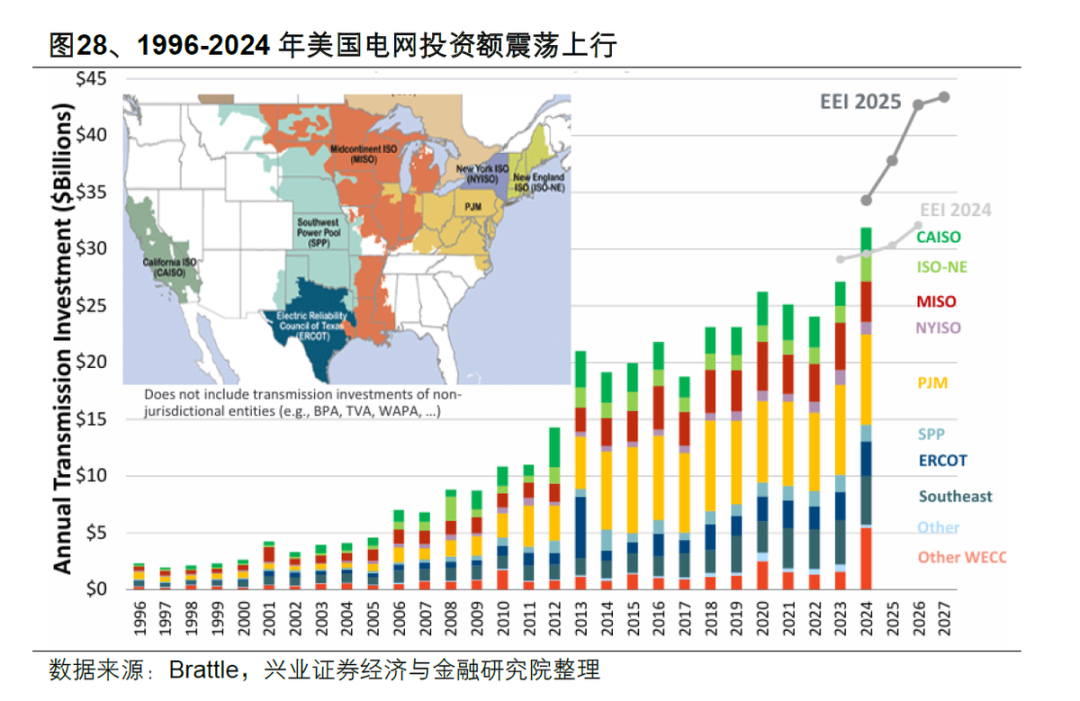
Grid Investment: Long-Term Low Levels and Low Willingness to Expand Capacity
Due to slow growth in U.S. electricity consumption after 2000, the hollowing-out of the domestic power equipment manufacturing industry (with key components such as transformers highly dependent on imports and facing a shortage of skilled technicians), and the fragmented ownership of the U.S. grid (primarily privately owned), grid investment in the U.S. has remained at a low level for a long time (averaging about $20-30 billion annually over the past decade, only surpassing $30 billion in 2024).
Moreover, investment has primarily flowed toward "replacing aging infrastructure" and "reinforcing grid reliability," with very little capacity expansion investment driven by "load growth."
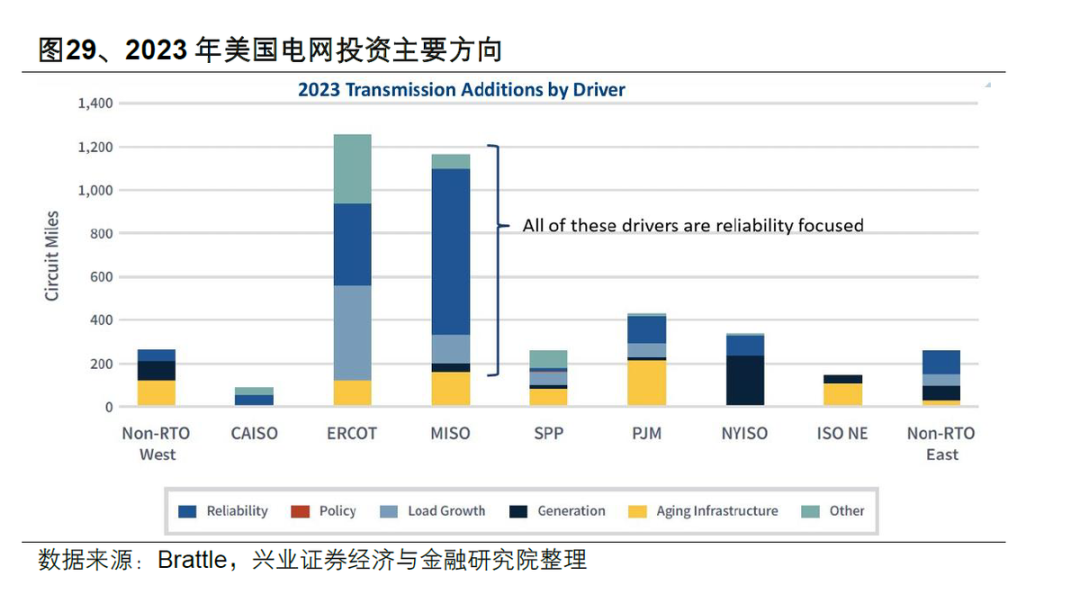
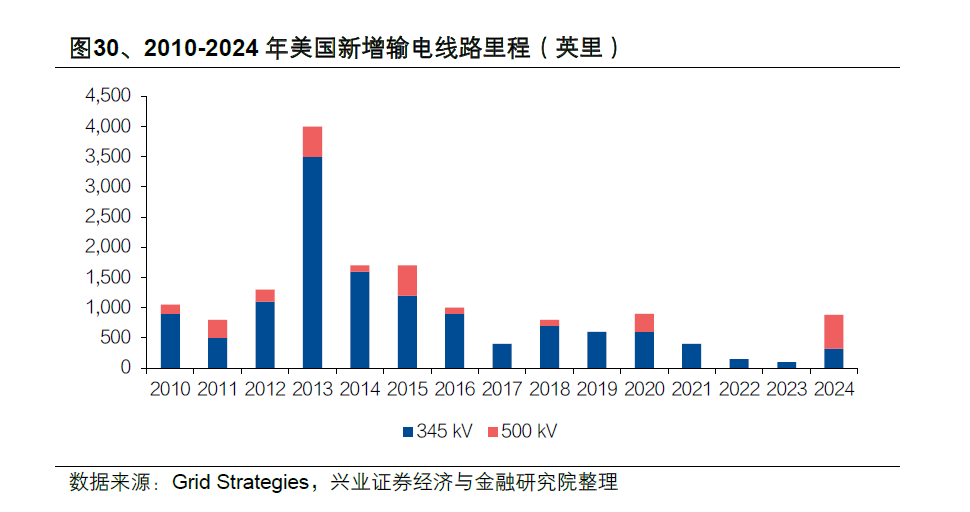
Grid Construction: A Huge Gap
The annual mileage of new high-voltage transmission lines in the U.S. has significantly decreased since 2013. In 2024, only 888 miles of high-voltage transmission lines (345KV and above) were added, less than 20% of the U.S. Department of Energy's (DOE) annual planning requirement of 5,000 miles.
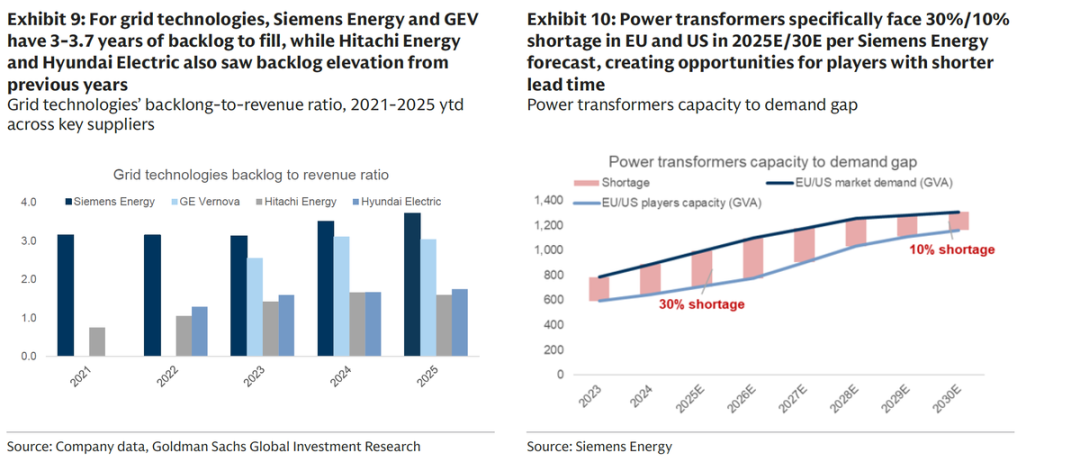
Power Transformers: The "Bottleneck" for Grid Expansion
Power transformers, due to their highly customized nature (each transformer must consider unique impedance, cooling, tap changers, overload, and seismic standards), labor-intensive manufacturing, and stringent certification cycles, cannot be rapidly expanded through standardized assembly lines.
In the U.S., domestic suppliers can currently only meet about 30% of demand, and even with announced expansion plans, they are only expected to meet about 40% by 2027 (forecast). This has led to a shortage rate of about 30% for power transformers in the EU/U.S. by 2025, with delivery times for key transformers surging from 6-9 months in the past to 2-3 years, directly blocking the possibility of rapid grid expansion.
② New Impact – "Low-Quality Load" Crushes the Last Straw
When individual AI data centers, each requiring hundreds of thousands to millions of kilowatts (GW-scale), apply for grid connection, their enormous instantaneous power demands exceed the physical carrying capacity of regional grids:
A single high-density AI data center's load is equivalent to that of several medium-sized cities. This not only instantly depletes the redundant transmission capacity of local grids but also forces power operators to initiate a full suite of upgrades from substations to transmission networks.
At the same time, the violent (violent) fluctuations in AI computing load within milliseconds can cause high-frequency interference to aging grids, threatening regional power supply security. To assess this risk, grid operators (RTO/ISO) have to extend the "system impact study" process, further clogging the grid connection process.
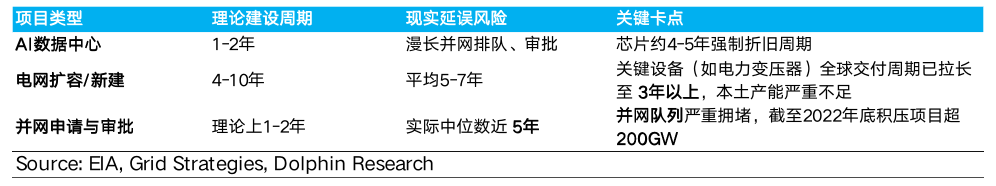
③ Core Conflict – A Devastating Mismatch in "Construction Cycles"
Due to the aforementioned physical bottlenecks, a critical "time mismatch" has emerged:
The theoretical construction time for AI data centers is only 18-24 months, while the expansion of matching (supporting) transmission networks and cross-regional lines, constrained by permitting approvals, environmental assessments, and the delivery of long-lead equipment (such as transformers), often takes 5-7 years or even longer.
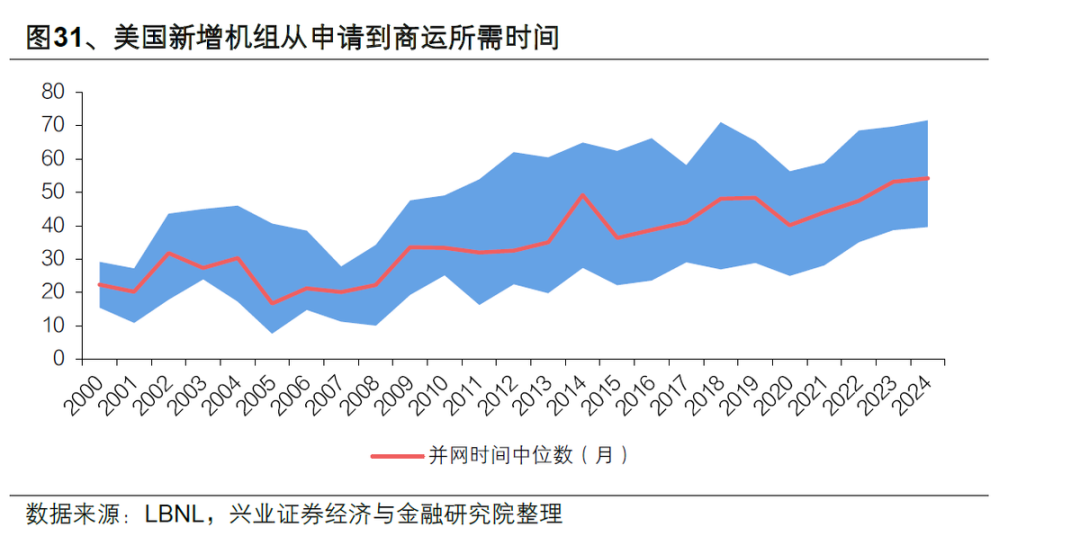
Although the Federal Energy Regulatory Commission (FERC) simplified administrative approvals through Order 2023 (theoretically reducing the process to 1-2 years), the grid connection queue congestion caused by "insufficient physical expansion" continues to worsen. Currently, the median grid connection wait time across the U.S. is nearly 5 years, and in core data center regions like Northern Virginia (VA), it has surged to 7 years.
This mismatch is devastating for data center operators, meaning that even if a data center is completed within a year or two, the hundreds of millions of dollars worth of GPU chips it purchased will rapidly depreciate due to lack of power, and the high sunk costs (depreciation) will directly erode corporate profits, causing the ROI model for AI investments to collapse.
Summary: Power Shortage is a Structural Contradiction
From the above analysis, it is clear that the current power shortage in the U.S. is not a short-term supply-demand imbalance but a structural contradiction arising from the explosive growth of AI computing power and the long-term lag in energy and grid infrastructure.
On the demand side, the dual drivers of manufacturing reshoring and rigid AI data center loads have propelled electricity demand into accelerated growth, with peak load pressures surging.
On the supply side, the continuous retirement of traditional high-reliability baseload power sources and the inability of wind and solar energy to fill the "capacity gap" through "energy substitution" have resulted in insufficient effective power supply capacity. On the grid side, aging facilities, lack of investment, shortages of key equipment, and mismatched construction cycles have further exacerbated the supply-demand contradiction.
In the next installment, Dolphin Research will continue to explore how the U.S. power shortage issue can be resolved, as well as the investment opportunities in corresponding sub-sectors. Stay tuned!
- END -
// Transfer Authorization
This article is an original work by Dolphin Research. Unauthorized reproduction is prohibited without permission.
// Disclaimer and General Disclosure
This report is for general comprehensive data purposes only, intended for users of Dolphin Research and its affiliated institutions for general reading and data reference. It does not take into account the specific investment objectives, investment product preferences, risk tolerance, financial situation, or special needs of any individual receiving this report. Investors must consult with independent professional advisors before making investment decisions based on this report. Any person making investment decisions using or referring to the content or information in this report does so at their own risk. Dolphin Research shall not be liable for any direct or indirect responsibilities or losses that may arise from the use of the data contained in this report. The information and data in this report are based on publicly available sources and are for reference purposes only. Dolphin Research strives to ensure but does not guarantee the reliability, accuracy, and completeness of the information and data.
The information or opinions expressed in this report shall not, under any jurisdiction, be construed as or deemed to be an offer to sell securities or an invitation to buy or sell securities, nor shall they constitute advice, solicitation, or recommendation regarding securities or related financial instruments. The information, tools, and materials in this report are not intended for distribution to or use by individuals or residents of jurisdictions where such distribution, publication, provision, or use would contravene applicable laws or regulations or result in Dolphin Research and/or its subsidiaries or affiliated companies being subject to registration or licensing requirements in such jurisdictions.
This report only reflects the personal views, opinions, and analytical methods of the relevant contributors and does not represent the stance of Dolphin Research and/or its affiliated institutions.
This report is produced by Dolphin Research, and the copyright is solely owned by Dolphin Research. No institution or individual may, without the prior written consent of Dolphin Research, (i) make, copy, reproduce, duplicate, forward, or distribute in any form any copies or reproductions, and/or (ii) directly or indirectly redistribute or transfer them to other unauthorized persons. Dolphin Research reserves all relevant rights.
-
![]()
Li Bin Claims, 'Denying the Pure EV Trend is Like Ostrichism.' What's Li Xiang's Take?
-
Lenovo: Liu Jun Turns Left, Yang Yuanqing Turns Right
-
Lenovo: Liu Jun Goes Left, Yang Yuanqing Goes Right
-
![]()
MiniMax Shares Unlock: Cornerstone Shareholders Show Long-Term Optimism, Yet Stock Plummets Nearly 30% in Two Days; Zhipu Also Sees Nearly 20% Drop Today
-
![]()
Single-Day Plunge of 40%: The 'First AGI Stock' Faces More Than Just Share Price Concerns
-
![]()
Ricoh and Fuji Hike Prices on Legacy Edge; Insta360 Poised to Disrupt Mirrorless Camera Market
-
![]()
Ricoh and Fujifilm Raise Prices in Tandem, Relying on Established Reputations; Insta360 Poised to Disrupt Mirrorless Camera Market
-
![]()
Strategic Shift in Photoelectric Sensing: Maxvision Secures Controlling Stake in CAS Optotech