Hikvision: Stagnant Performance and R&D Downsizing, Can AI Spark Revival?
 04/21 2025
 877
877
Hikvision released its 2024 annual report and fourth-quarter financial report (as of March 2025) after the A-share market closed on April 18, 2025, Beijing time. Here are the key highlights:
I. Overall Performance: Persistent Decline
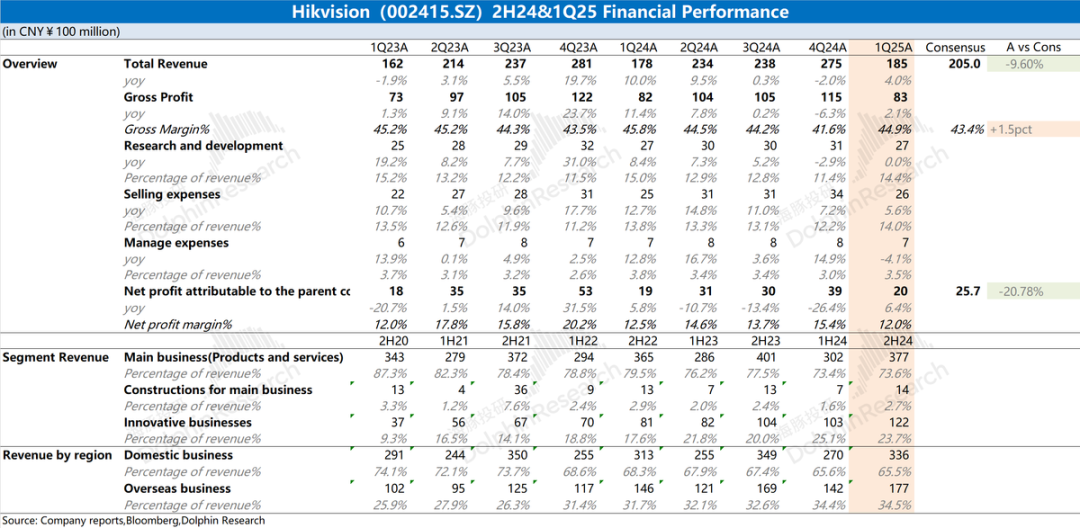
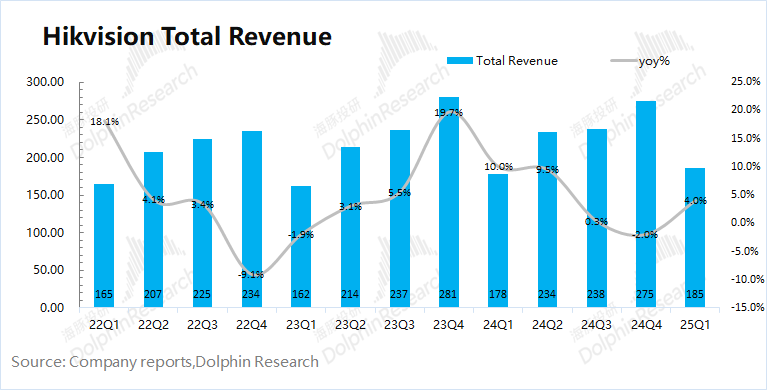
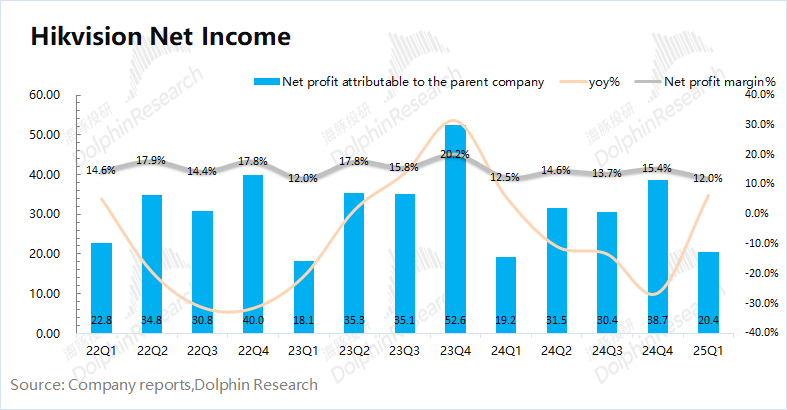
Hikvision reported revenue of 18.5 billion yuan in the first quarter of 2025, marking a 4% year-on-year increase. With the domestic core business languishing, growth was primarily fueled by innovative ventures; net profit attributable to shareholders stood at 2 billion yuan, a 6.4% year-on-year increase. Despite initiating cost-control measures, profit recovery remains contingent on downstream demand, which remains subdued.
II. Business Progress: Domestic Market Struggles
In the second half of 2024, all three domestic business groups witnessed declines. Notably, the Public Service Business Group (PBG) experienced a double-digit drop, performing the poorest among all divisions. Meanwhile, the Enterprise Business Group (EBG) and Small and Medium Business Group (SMBG) also recorded declines of varying magnitudes. Innovative businesses continued to grow at double-digit rates, serving as the primary growth engine for the company.
III. Software and Hardware Integration: Volatile Software, Robust Hardware
Since transitioning from a pure hardware vendor to a leading security company integrating software, Hikvision has maintained a dual-pronged approach. Dolphin Insights estimates that the company's software revenue share retreated to around 20% in the second half of 2024. Despite a decline in software business, hardware revenue, though slowing, sustained growth.
Overall View of Hikvision: Sluggish Growth, No Signs of Improvement
While Hikvision's revenue increased marginally in Q1, its gross profit margin continued to decline year-on-year. This quarter's growth was primarily driven by innovative businesses, compensating for the domestic core business's decline, resulting in single-digit growth overall.
Examining the annual report, both innovative and overseas businesses have expanded, albeit at a decelerating rate. The domestic core business remains stagnant, with no signs of improvement. Affected by government finances, PBG continued to decline, reaching a five-year low in the second half. EBG and SMBG also suffered setbacks, with enterprise demand failing to rebound. Amid weak demand, the company proactively reduced supply chain inventory levels.
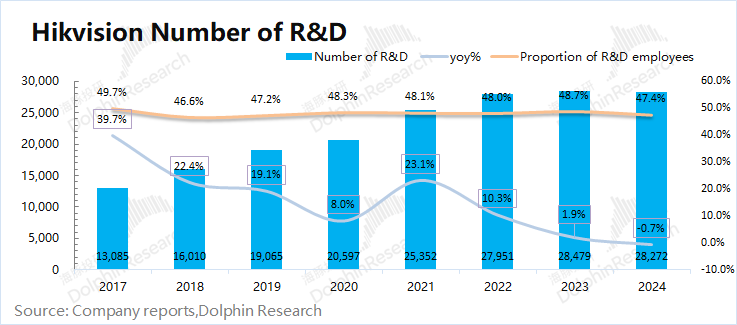
The number of R&D personnel, which had been increasing annually, fell in 2024, indicating cost-control measures. While these measures can bolster short-term performance, they do not constitute a sustainable growth strategy. Accelerated business and revenue growth is crucial for long-term prospects.
In this context, Hikvision hopes to transform through AI integration. Leveraging the "Guanlan" large model, the company has launched related products and plans to merge its self-developed model with an intelligent computing platform. However, this has yet to impact operational performance.
Market expectations for Hikvision have dimmed due to economic uncertainties and downstream industry challenges, leading to share price fluctuations. The market is keenly observing operational improvements and AI model integration. Success in these areas could reignite market confidence; otherwise, the company may continue to struggle.
Detailed Analysis
I. Core Data: Persistent Decline
1.1 Revenue
Hikvision generated revenue of 18.5 billion yuan in Q1 2025, a 4% year-on-year increase. Growth was primarily driven by innovative and overseas businesses, with the domestic market remaining sluggish.
1.2 Gross Margin
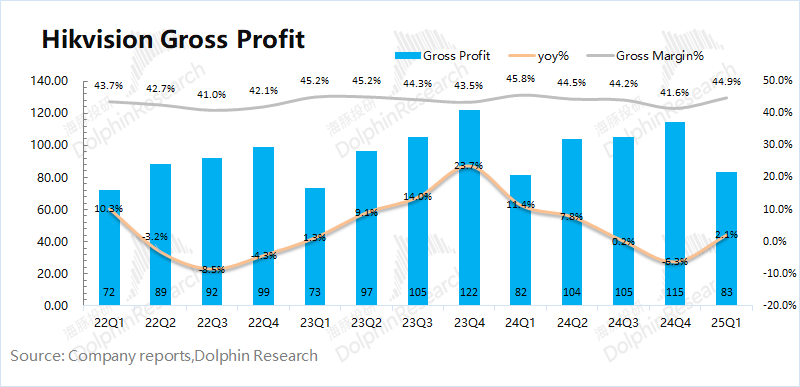
Gross profit for Q1 2025 was 8.3 billion yuan, a 2.1% year-on-year increase. The gross profit margin fell to 44.9%, a 0.9 percentage point decline, primarily due to the domestic core business's decline and reduced software business share.
1.3 Core Expenses
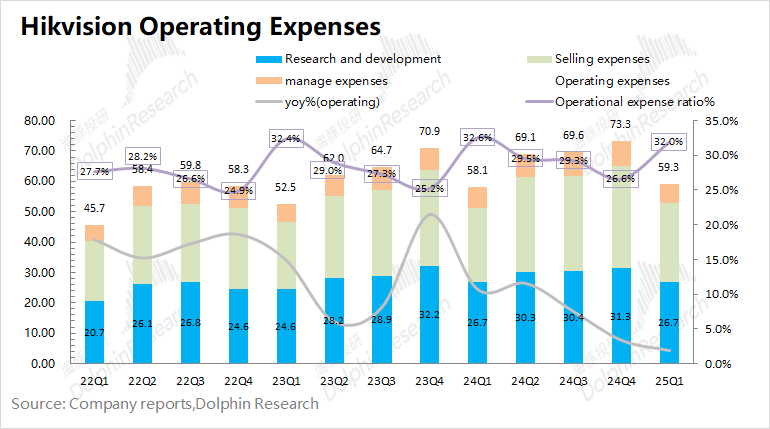
Total core expenses (selling, management, and R&D) amounted to 5.93 billion yuan, a 1.9% year-on-year increase. The combined expense ratio remained at 32%, a 0.6 percentage point decrease.
- Selling Expenses: 2.601 billion yuan, a 5.6% year-on-year increase, with a ratio of 14%, up 0.2 percentage points.
- Management Expenses: 652 million yuan, a 4.1% year-on-year decrease, with a ratio of 3.5%, down 0.3 percentage points.
- R&D Expenses: 2.67 billion yuan, flat year-on-year, with a ratio of 14.4%, down 0.6 percentage points. R&D personnel declined by over 200 to 28,300 by the end of 2024, the first such drop in recent years.
Amid persistent performance issues, the company has begun to control expenses in management and R&D.
1.4 Net Profit Attributable to Shareholders
Net profit for Q1 2025 was 2.04 billion yuan, a 6.4% year-on-year increase. The net profit rate stood at 12%, a historical low, primarily due to weak domestic demand affecting all three business groups (PBG, EBG, SMBG), leading to sluggish revenue and declining gross profit margins.
II. Business Progress: Domestic Market Struggles Persist
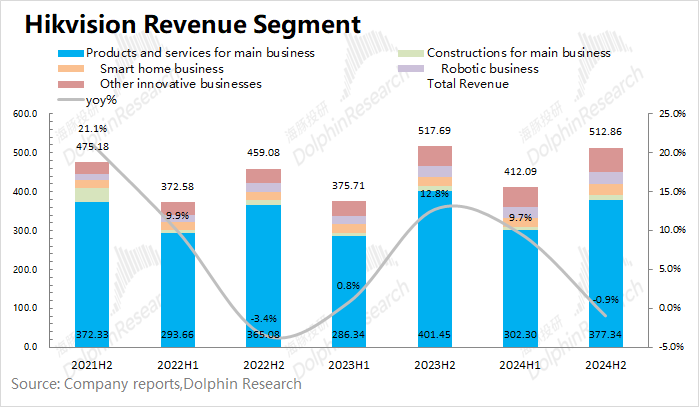
Since 2021, Hikvision has ceased detailed disclosure of "front-end products," "back-end products," and "central control products," instead categorizing them under "main products and other products." The financial report now focuses on innovative business progress, reflecting a shift in development priorities.
- Main Products and Other Product Businesses: Remain the largest revenue source, contributing 76% in H2 2024. Despite a declining share due to domestic market stagnation, they still account for the majority of revenue.
- Innovative Businesses: Continue to grow, accounting for 24% of revenue in H2 2024, a 4 percentage point increase year-on-year. Automotive and thermal imaging businesses were key growth drivers.
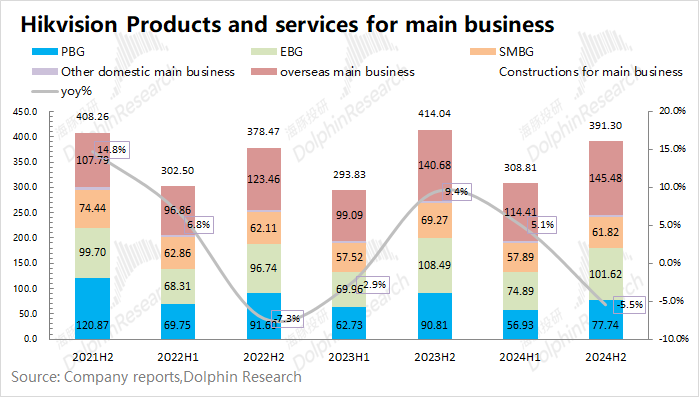
2.1 Main Products and Services
Revenue from main products and services was 39.13 billion yuan in H2 2024, a 5.5% year-on-year decline. All three domestic business groups recorded declines: PBG (-14.4%), EBG (-6.3%), and SMBG (-10.8%). Overseas revenue, at 14.55 billion yuan, increased by 3.4%, outperforming the domestic market.
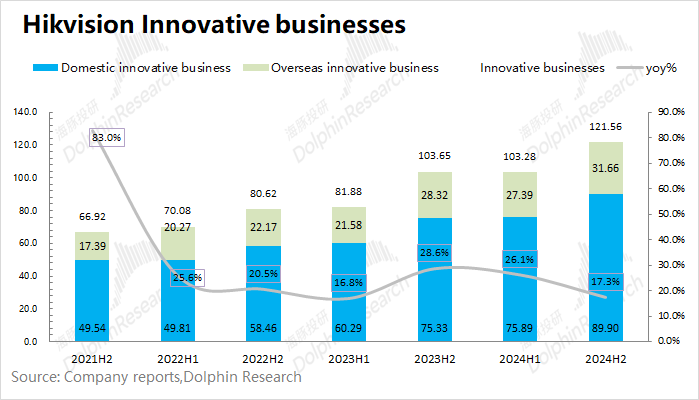
2.2 Innovative Businesses
Innovative businesses generated revenue of 12.156 billion yuan in H2 2024, a 17.3% year-on-year increase. While comprising only a quarter of total revenue, they are currently the primary growth engine. Both automotive and thermal imaging businesses grew by over 30%.
III. Software and Hardware Integration: Volatile Software, Robust Hardware
Hikvision combines hardware (e.g., cameras) with subsequent software services, embodying its "software and hardware integration" framework. How did the company perform in both areas?
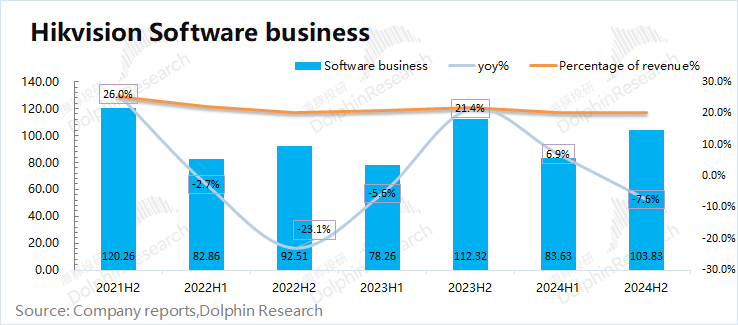
3.1 Software
While Hikvision does not disclose software revenue separately, Dolphin Insights estimates it at 10.38 billion yuan in H2 2024, a 7.6% year-on-year decline. Software's contribution to total revenue fell to around 20%.
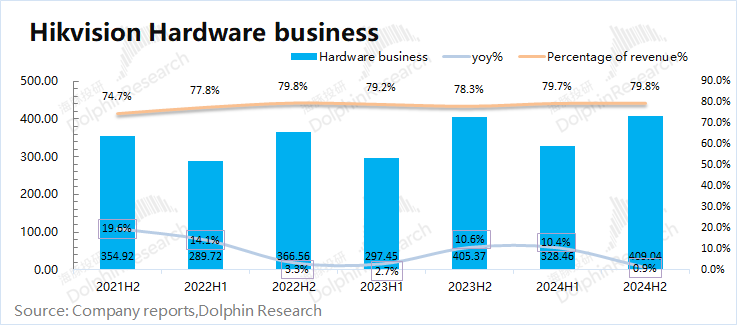
3.2 Hardware
Hardware revenue was 40.9 billion yuan in H2 2024, a 0.9% year-on-year increase. Comparatively, hardware maintained a growth trajectory while software declined significantly. Hardware businesses (e.g., surveillance equipment) exhibit better risk resilience, whereas software is more sensitive to economic conditions.
- END -
// Reprint Authorization
This article is an original by Dolphin Insights. For reprints, please obtain authorization.
// Disclaimer and General Disclosure Prompt
This report is intended solely for general data use and browsing, serving as a reference for users of Dolphin Insights and its affiliated institutions. It does not account for the specific investment goals, product preferences, risk appetite, financial status, or individual needs of any recipient. Investors are advised to consult independent professional advisors before making investment decisions based on this report. Those who make investment decisions using or referencing the content herein do so at their own risk. Dolphin Insights accepts no responsibility for any direct or indirect liabilities or losses arising from the use of the data in this report. The information and data are sourced from publicly available resources and are provided for reference only. Dolphin Insights endeavors to ensure, but cannot guarantee, the reliability, accuracy, and completeness of the information and data presented.
The information or opinions contained in this report should not be construed as an offer to sell or a solicitation to buy any securities in any jurisdiction, nor do they constitute recommendations, solicitations, or offers for securities or related financial instruments. The content, tools, and materials in this report are not intended for distribution to or use by any person or entity in jurisdictions where such activities would violate local laws or regulations, or subject Dolphin Investment Research and/or its subsidiaries or affiliates to registration or licensing requirements.
This report embodies solely the personal views, opinions, and analytical methods of the author and does not represent the position of Dolphin Investment Research and/or its related entities.
Produced by Dolphin Investment Research, this report is copyrighted solely by Dolphin Investment Research. Without the prior written consent of Dolphin Investment Research, no institution or individual may (i) produce, copy, replicate, reproduce, forward, or distribute in any form or manner, and/or (ii) directly or indirectly redistribute or transfer to other unauthorized persons. Dolphin Investment Research retains all relevant rights.
-
![]()
Model Giant Jieyue Xingchen Steps into Smartphone Arena: A Strategic Alliance with Huaqin Technology
-
![]()
Big Model Firm Dives into Phone Market: StepFun and Wingtech Forge a ‘Dynamic Duo’
-
![]()
Zhongrun Optics Makes a Bold Move with 1 Billion Yuan Investment: Is a Turning Point on the Horizon for the Precision Optics Industry?
-
![]()
Deploy CLBO Crystals and YIG Single Crystals! Erythritol Leader Invests 30 Million in Youwei Optoelectronics
-
CXMT’s July 16 Subscription: Leading Domestic Memory Manufacturer—What’s the Earning Potential per Lot?
-
![]()
Rhythm Discrepancy and Premium Value Erosion: Foreign Luxury Brands Must Re-evaluate Their China Strategy
-
![]()
Half-Year, 1 Billion Yuan Financing, 7 Billion Yuan Valuation: A New Dark Horse Emerges in the Embodied AI Sector
-
![]()
Strong Rebound for Tech Stocks in Hong Kong Stock Market: Is It Time to Bottom-Fish?