Uber: Strong Performance Plummets, Will Tesla Really 'Take Over'?
 02/13 2026
 581
581
'International Didi' Uber released its Q4 2025 earnings report before the U.S. stock market opened on the evening of February 4. Overall, driven by impressive user growth, core businesses showed strong growth. However, increased investment and subsidies for user acquisition led to weaker-than-expected profit performance. Key details are as follows:
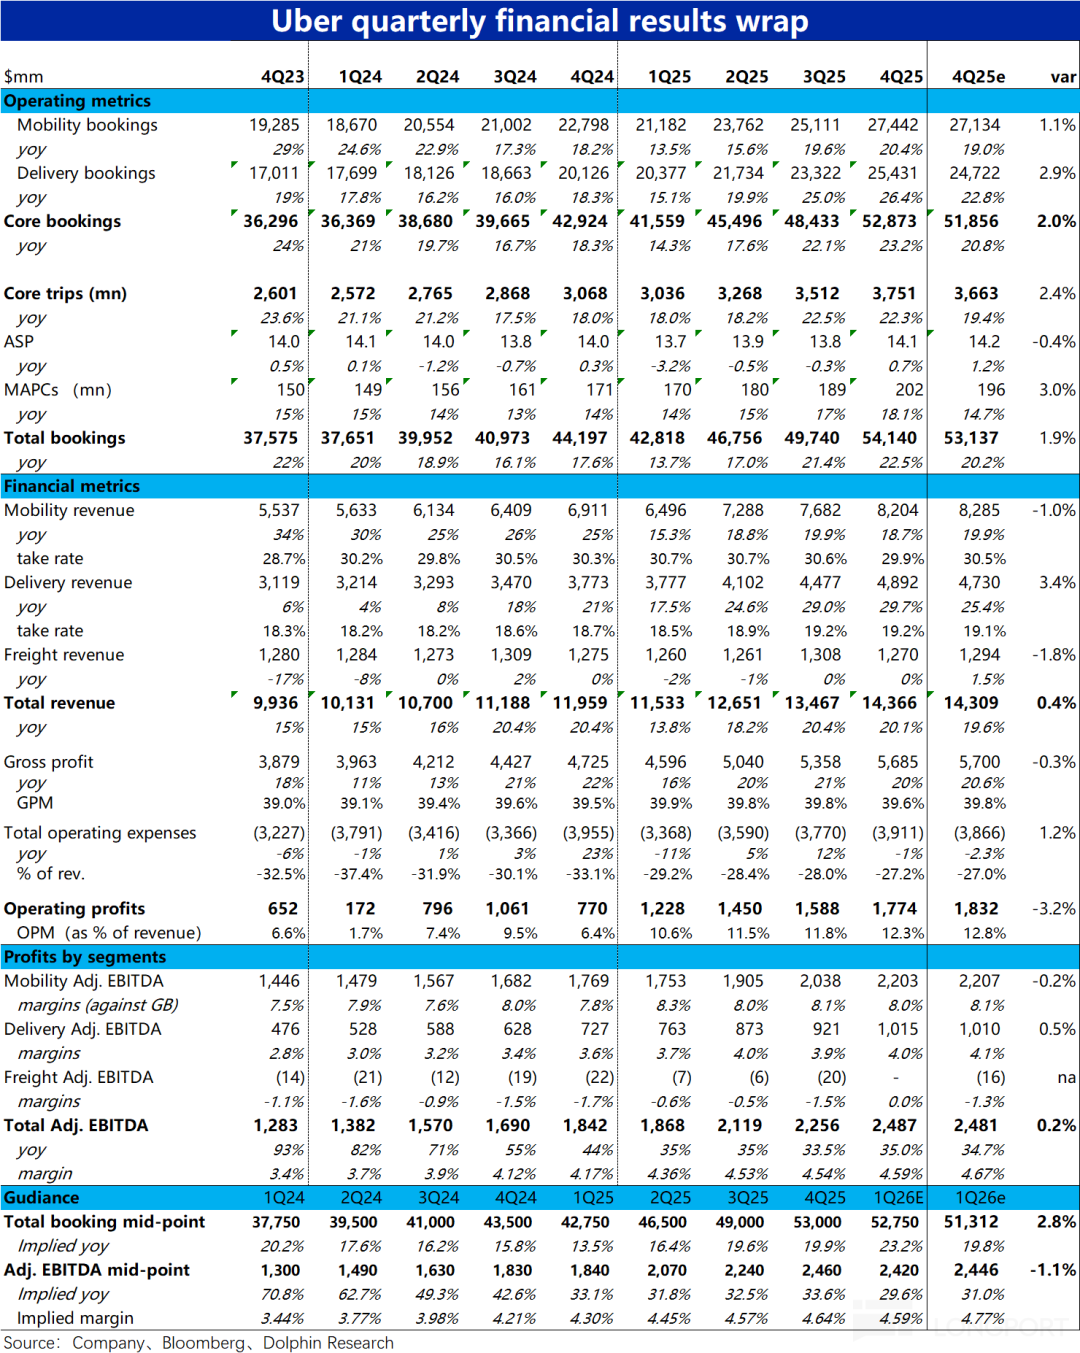
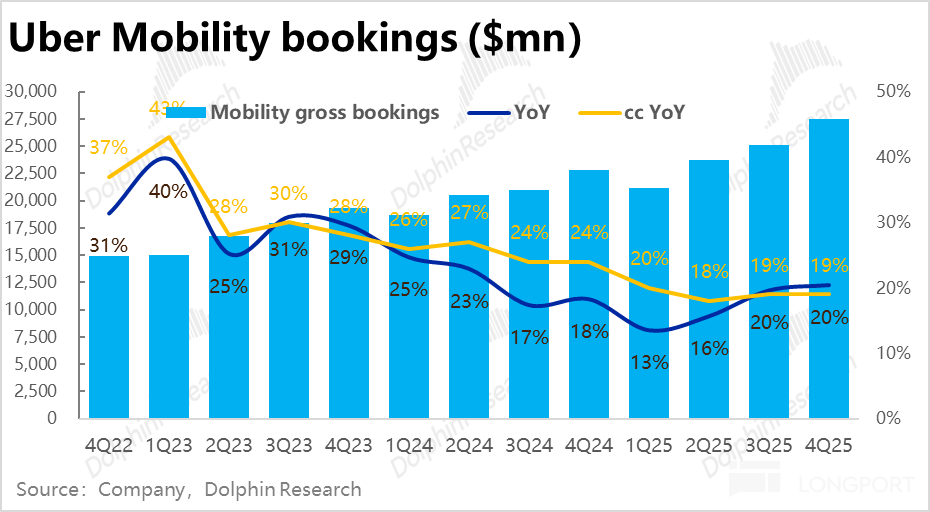
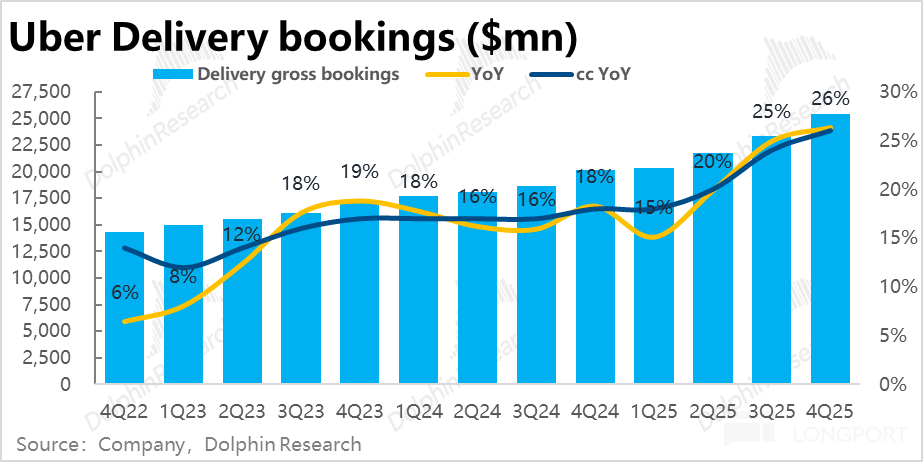
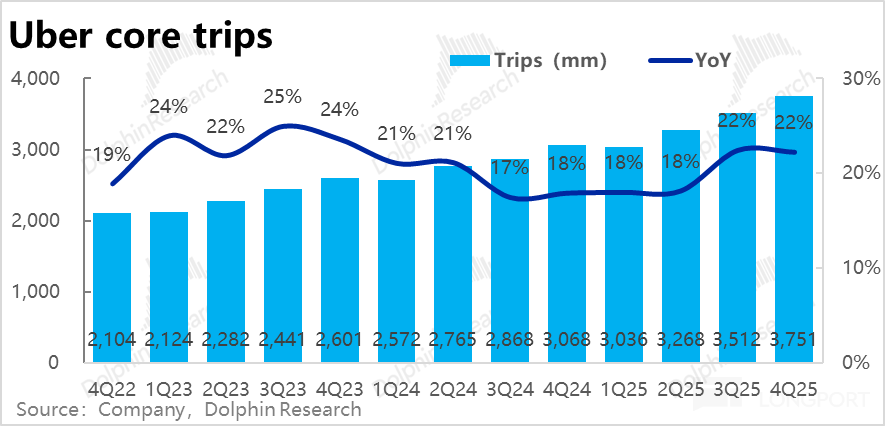
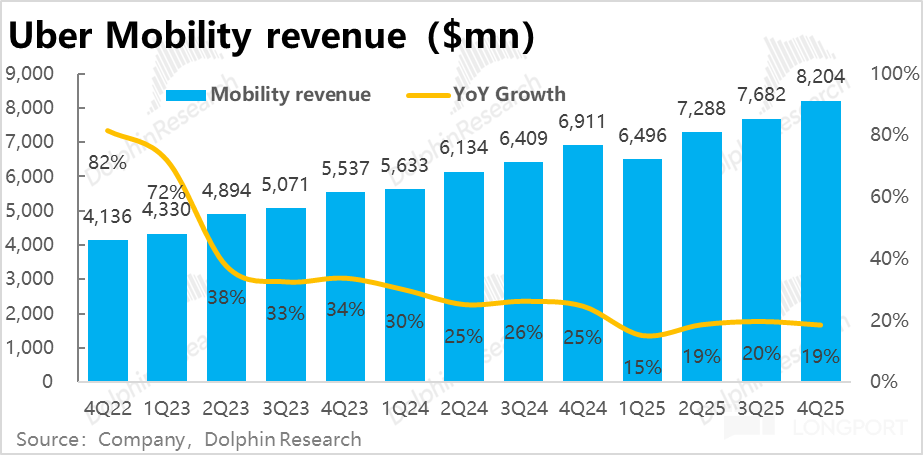
1. Strong growth in core businesses: Ride-hailing bookings grew 20.4% YoY this quarter, or 19% excluding FX benefits, maintaining the same growth rate as the previous quarter. Food delivery growth was even stronger, with booking value growing 26.4% YoY, accelerating by 2 percentage points sequentially even excluding FX benefits. Annual growth (at constant FX) rose from 18% to 26% over the year.
Part of this growth came from the acquisition of Trendyol Go's food delivery business, which contributed 2-3 percentage points to booking growth according to some investment bank estimates. Additionally, expansion into non-dining categories like groceries and daily necessities likely contributed.
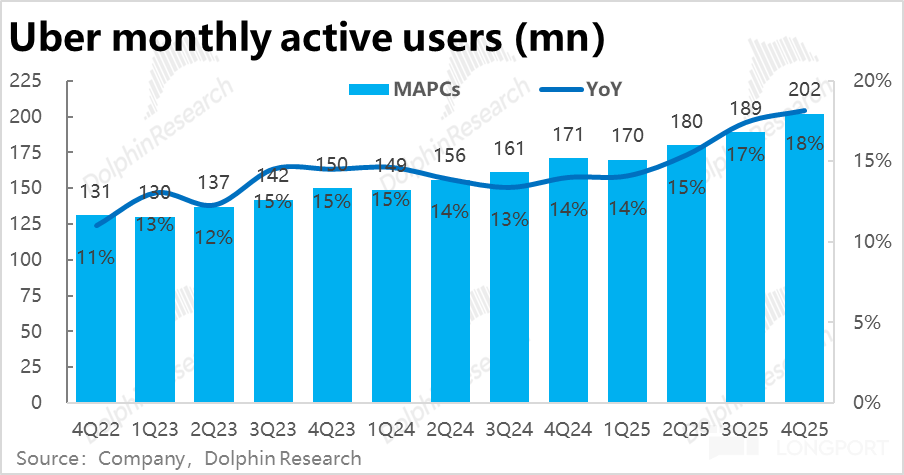
2. Active user growth drives strong performance: The increase in business bookings against macroeconomic trends was primarily attributable to strong growth in monthly active users (MAUs). MAU growth accelerated from 14% to 18% over the year, perfectly correlating with the acceleration in booking growth.
Recent company initiatives suggest that expansion of food delivery from dining to non-dining categories, ride-hailing 'customer incentives' to stimulate user growth, and product penetration into lower-tier markets likely explain the sustained user acceleration and relatively modest profit margin expansion.
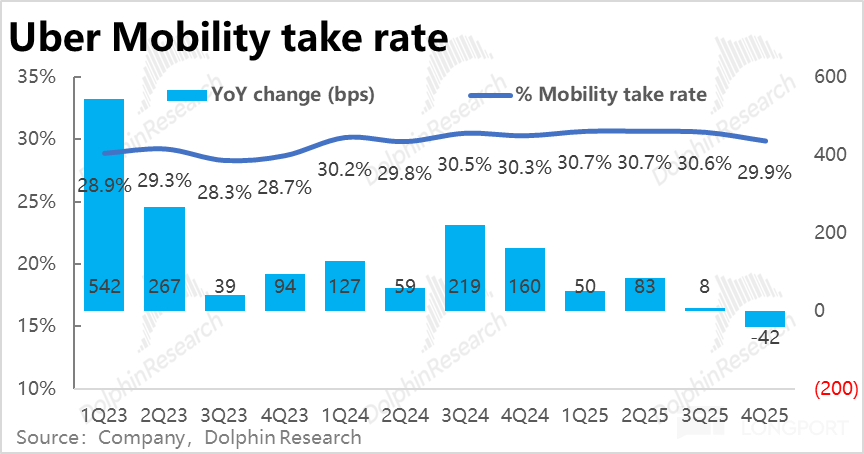
3. Ride-hailing monetization declines while food delivery improves: The ride-hailing monetization rate fell 42 basis points YoY this quarter, the first decline since 2021. This caused revenue growth to slow to 18.7%, missing market expectations of 19.9%. This likely reflects the company's strategy of ceding profits to users.
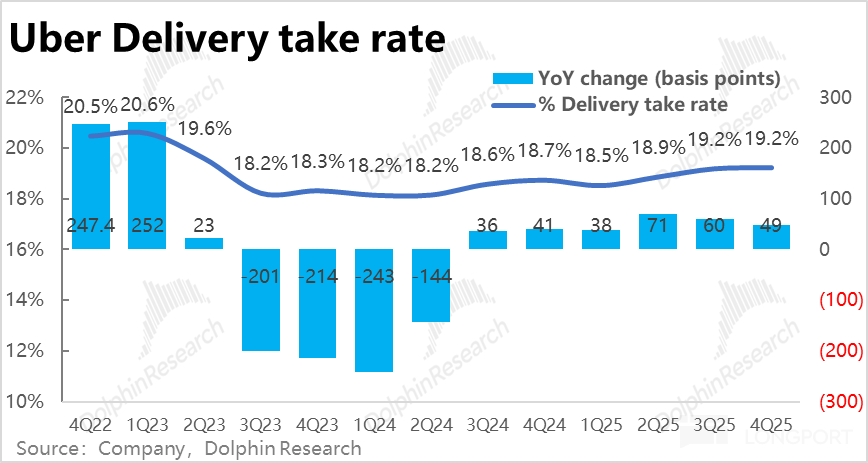
The food delivery monetization rate continued to rise, increasing about 60 basis points YoY despite already high base effects. This drove delivery revenue growth to accelerate by 4 percentage points sequentially to 29%, outpacing booking growth, likely due to advertising monetization. Annualized advertising revenue reached $2 billion, equivalent to 1.8% of food delivery booking value.
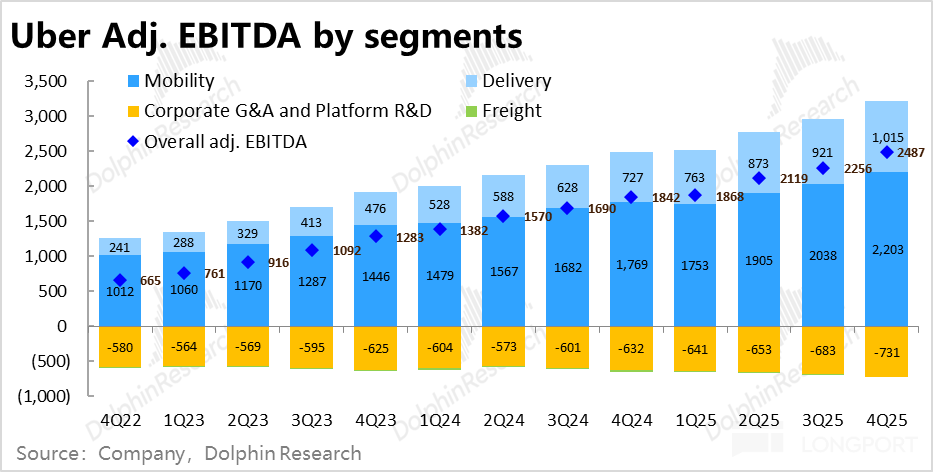
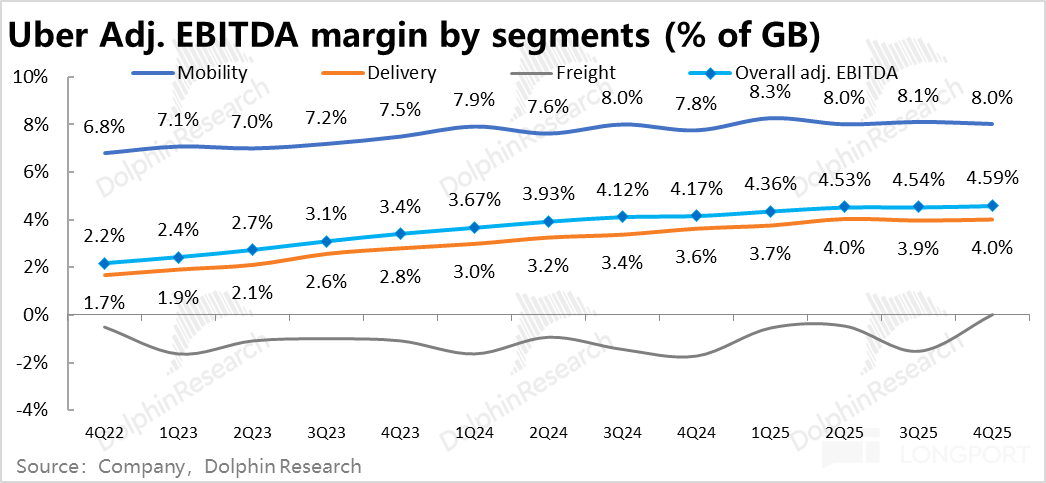
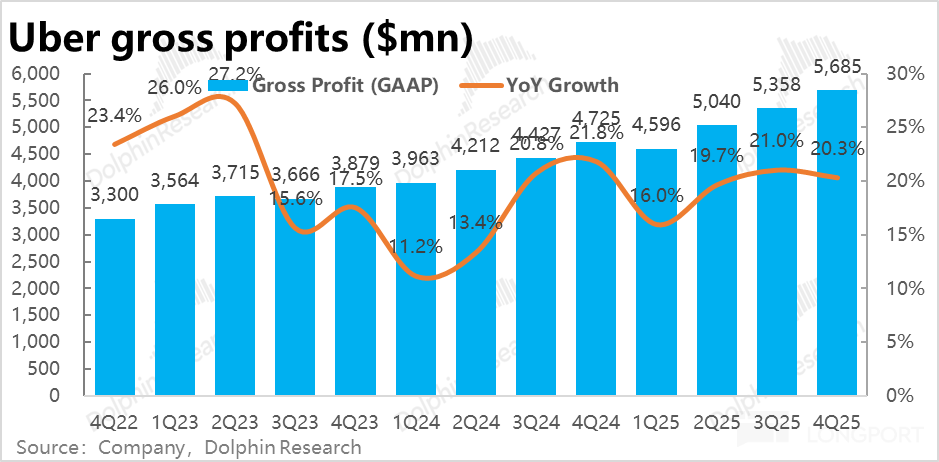
4. Solid profits but margins miss expectations: Group adjusted EBITDA reached $2.49 billion this quarter, up 35% YoY, maintaining strong growth. The profit margin (as a percentage of bookings) was 4.59%, still showing YoY improvement but falling short of market expectations of 4.77%.
By business segment: 1) Ride-hailing adj.EBITDA margin was 8%, down 0.1 percentage point sequentially and below expectations of 8.1%, resulting in slightly lower profits than expected.
2) Food delivery profits exceeded expectations due to continued margin expansion (up 0.1 percentage point sequentially to 4%). While expected margins were higher at 4.1%, significantly stronger-than-expected booking growth resulted in overall profits beating forecasts.
5. Cost of strong user acquisition: Gross margin pressure and rising expenses: From a cost perspective, gross margin was 39.6% this quarter, down slightly sequentially (though still up YoY) and slightly below expectations of 39.8%. Despite recent declines in ride-hailing insurance costs, margins still missed expectations, suggesting savings were reinvested into user subsidies.
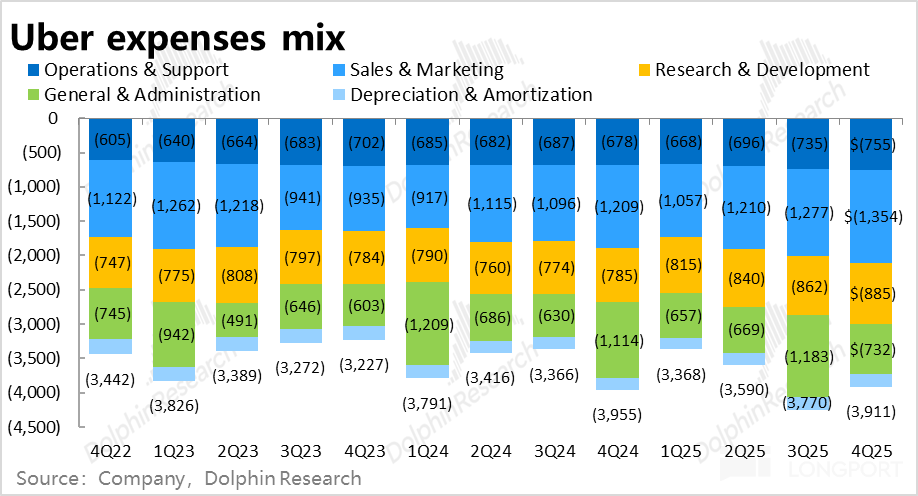
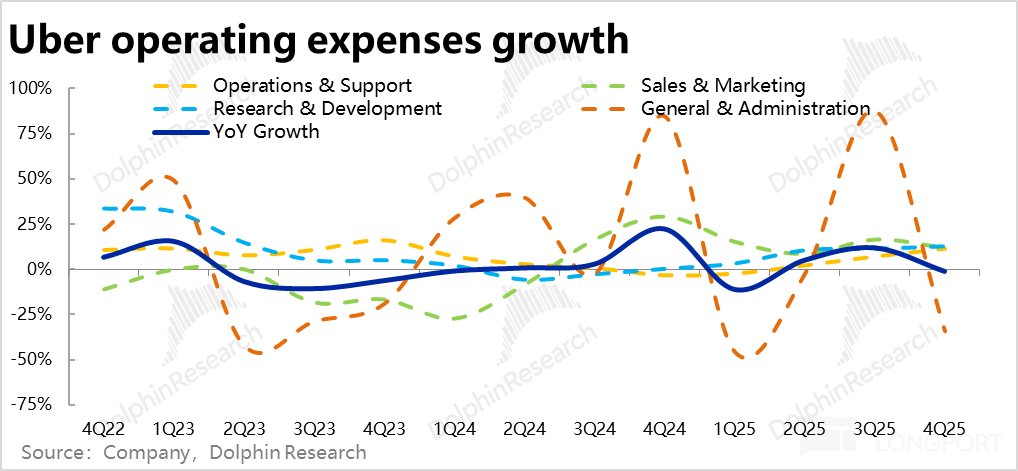
Total operating expenses appeared to decline 1% YoY this quarter, suggesting significant cost control. However, this was primarily due to a one-time $460 million legal expense in the prior year. Excluding this, total expenses grew 12%.
While still significantly below revenue growth, this represents a marked acceleration from previous low-single-digit expense growth, causing margin expansion to narrow and fall slightly below expectations.
6. Guidance - Next quarter shows similar growth but margin pressure: For Q1 2026, the company guided for total booking growth of 17%-21% at constant FX, consistent with the previous two quarters' guidance. Given recent performance typically meeting upper guidance limits, this suggests next quarter's growth will remain robust and in line with this quarter.
The midpoint of adj.EBITDA guidance implies a 4.59% profit margin, flat with this quarter and below market expectations of 4.77%. If realized, this would mark the first quarter since 2021 without sequential group margin expansion, indicating rising expenses and margin pressure.
Dolphin Research View:
Dolphin Research believes the primary investment dilemma for Uber lies in balancing its current strong performance against the likely but uncertain future impact of autonomous ride-hailing.
1. Current strong performance
As seen above, Uber's current quarterly performance is undoubtedly solid. Under its strategy of marginally increased investment and profit cession to stimulate user growth, core ride-hailing and delivery businesses maintained strong booking growth with an accelerating trend.
While this has slowed the YoY margin expansion trend (though not reversed it), profit growth of about 30% (adj.EBITDA) for recent quarters and next quarter's guidance remains quite impressive, if not exceeding higher expectations.
Key business trends:
1) Food delivery expansion from dining to groceries and daily necessities represents a massive growth opportunity, not just in booking value but also in expanding platform user scale and engagement.
2) For ride-hailing, declining insurance costs and threats from autonomous vehicles have prompted a strategy of ceding profits to consumers to attract users and promote growth in lower-tier products (like budget ride-hailing) and markets. This trades short-term margin pressure for stronger business scale and barriers.
3) Advertising monetization (especially in food delivery), while still modest in absolute terms ($2 billion annualized), contributes significantly to profitability given advertising's extremely high margins (typically 60-70%+ gross margins), supporting continued margin expansion for the delivery business and group.
2. Progress in autonomous ride-hailing
Despite strong recent performance, the threat of AI-driven autonomous ride-hailing remains an inescapable risk until implementation. The company devoted significant discussion to emphasizing its continued competitive advantages in the autonomous era (details available in company presentations and earnings call transcripts).
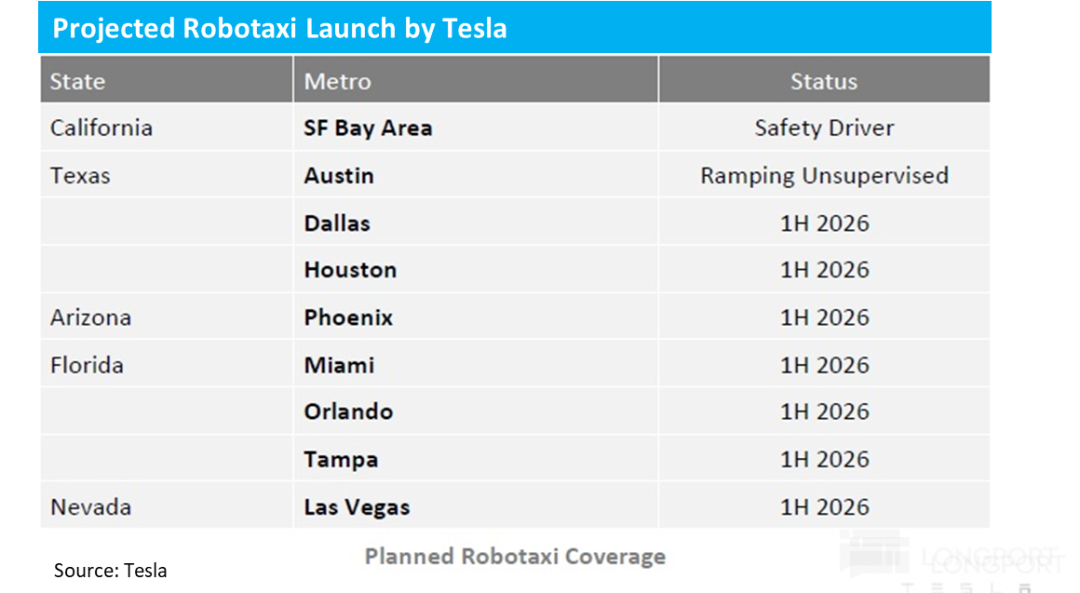
a. Tesla and Waymo progress: Recent technological advances in Tesla's FSD v13 (eliminating safety drivers) and the commencement of commercial Robotaxi operations mean autonomous ride-hailing in the U.S. will move from limited trials to rapid expansion in 2026.
This has reignited market concerns about the potential impact on incumbents like Uber, contributing to a nearly 20% decline in Uber's stock price from its November 2025 high.
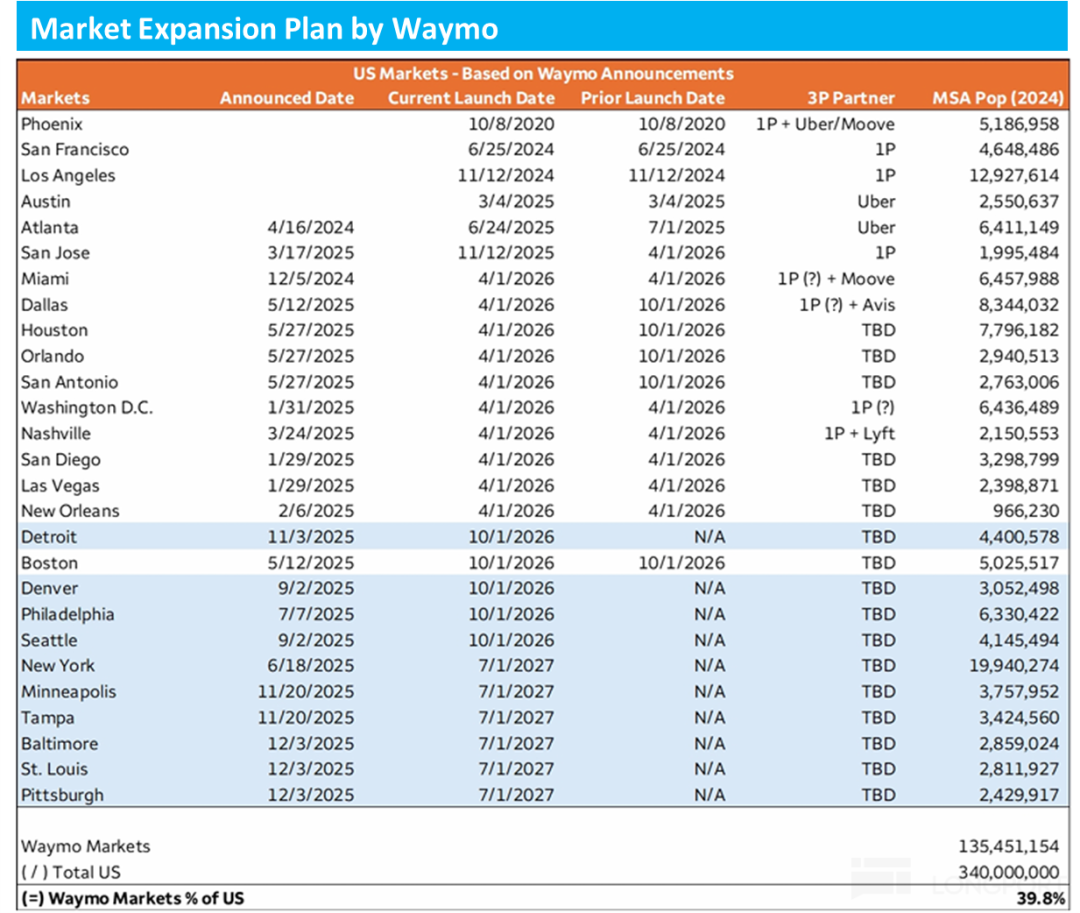
Tesla aims to cover 25-50% of U.S. regions by the end of 2026 (depending primarily on regulatory approvals), targeting dozens of major cities with fleet size expected to double monthly.
Similarly, Waymo plans to cover 40% of the U.S. population with its autonomous ride-hailing service by mid-2027.
If these timelines hold, autonomous ride-hailing will quickly evolve from niche novelty to widely available service within 1-2 years, beginning to substantially capture market share from human-driven ride-hailing and Uber.
(That said, Waymo's target of 1 million weekly rides by end-2026 would still represent just 1-2% of the U.S. market, suggesting ride volume ramp-up will take time).
Another key trend is Waymo's oscillation between a closed 1P model (customer acquisition through its own app) and an open 1P+3P model (also leveraging third-party apps). Since June 2025, only 1 of Waymo's 5 new operational cities has adopted the 1P+3P model (in partnership with Lyft), suggesting increasing preference for the closed 1P approach. Tesla has consistently maintained a closed 1P model.
This implies leading autonomous platforms like Tesla and Waymo (with the capability and user scale to build independent customer acquisition channels) are more likely to become pure competitors rather than partners for Uber.
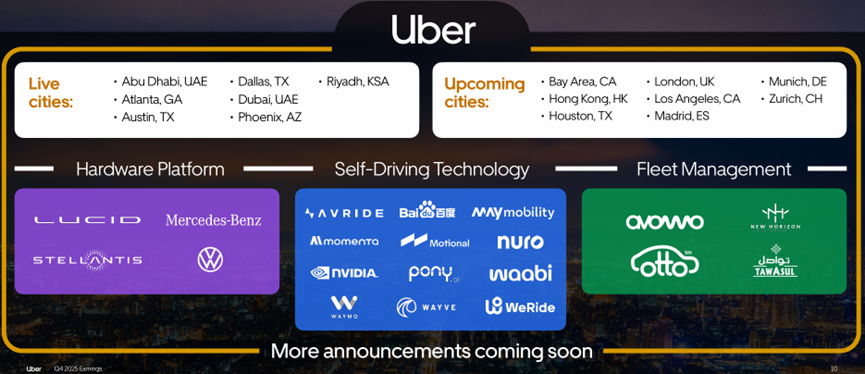
b. Uber's response - Building cooperative ecosystems: Uber hasn't remained passive, instead pursuing partnerships with as many 'secondary' autonomous technology providers as possible to avoid market domination by Tesla and Waymo.
Since 2025 alone, Uber has formed partnerships with 7 autonomous technology companies and automakers to jointly provide autonomous ride-hailing services in multiple U.S. and global cities.
Uber envisions an autonomous ride-hailing model fundamentally opposite to Tesla's. While Tesla pursues a vertically integrated closed model combining vehicle hardware, autonomous technology, and ride-hailing operations, Uber aims to disaggregate these functions and create an open ecosystem with multiple participants to prevent monopolization.

c. Key question - Will autonomous driving be closed monopoly or open ecosystem? Dolphin Research has consistently maintained that the impact on Uber and the ride-hailing market depends on whether autonomous driving technology becomes monopolized by oligopolies like Tesla/Waymo or remains a 'general technology' with numerous providers.
The essential difference is whether autonomous ride-hailing revolutionizes only the supply of transportation capacity or also significantly alters the current demand-side access points.
In a monopoly endgame, Uber risks substantial market share loss or even market exit. In an open ecosystem, autonomous vehicles would primarily provide abundant, lower-cost capacity to the industry.
Given Uber's scale advantages in demand/supply integration, it could still maintain significant market share in the autonomous era. Considering cost reductions might expand overall industry size, Uber's absolute business volume might not decline even with some share loss.
Dolphin Research leans against making hasty predictions at present, preferring to monitor for clearer indicators.
3. Valuation: Based on our calculations, Uber's current market cap implies about 19x 2026 and 16.5x 2027 GAAP PE (excluding any autonomous ride-hailing impact from profit forecasts).
As noted earlier, considering only recent performance trends, these 16-19x PE multiples appear inexpensive or even cheap for a company still growing revenues ~20% and profits ~30%.
The issue lies beyond 2027 when autonomous ride-hailing impacts become material (Wells Fargo projects Waymo alone could capture ~6% of U.S. ride-hailing volume by 2028). This would significantly reduce visibility into Uber's subsequent performance, meaning the seemingly cheap 2027 valuation might not prove attractive by 2028.
In summary, while recognizing Uber's operational excellence and strong current performance, we heed the Chinese proverb 'A wise man does not stand under a precarious wall.' With many excellent companies available, we prefer avoiding those with significant long-term logical risks.
If investing, we would either pursue a medium-term trend trade exiting before autonomous implementation, or demand a substantial discount to compensate for potential 'zero' risk to the ride-hailing business.
Detailed analysis follows:
I. Core businesses maintain rapid growth, driven by user expansion
Uber's two core businesses continued strong growth this quarter. Ride-hailing (Mobility) bookings grew 20.4% YoY, or 19% excluding FX benefits, better than consensus expectations for sequential deceleration.
Uber Eats performed even stronger, with booking value growth accelerating to 26.4% YoY, up 2 percentage points sequentially even excluding FX benefits. Annual growth (at constant FX) rose from 18% to 26% over the year.
Partial benefits came from the Trendyol Go acquisition, which some investment banks estimate contributed 2-3 percentage points to booking growth (though the company hasn't disclosed specific impacts). Additionally, while no new category expansion metrics were announced this quarter, the contribution from groceries and daily necessities likely continued.
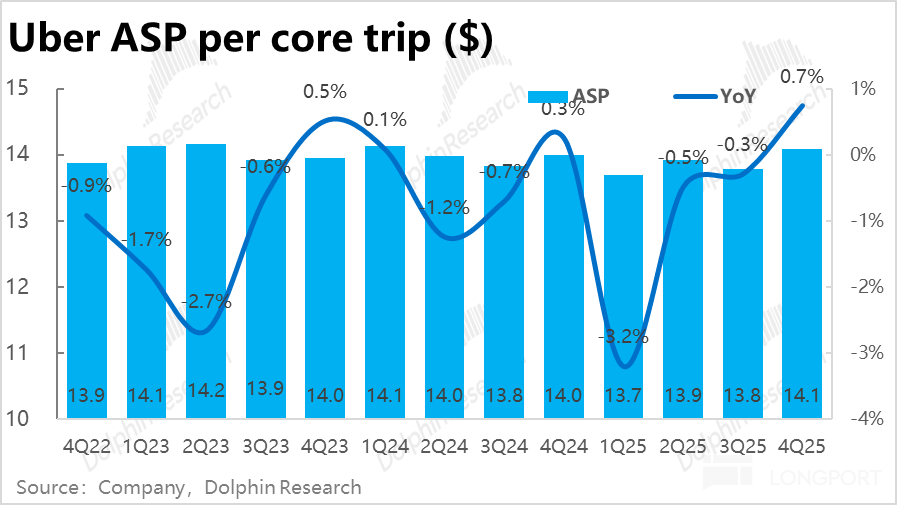
In terms of the driving factors of price and volume, Uber's core order value has achieved accelerated growth despite a not-so-favorable macroeconomic consumption environment, primarily driven by healthier volume growth. In this quarter, the core business order volume increased by 22.3% year-over-year and remained flat sequentially at a high level. Meanwhile, the average order value also reversed its year-over-year decline, increasing by 0.7%.
Since the company previously indicated that it would reinvest some of its profits into users to accelerate market penetration and user growth, the increase in the average order value this quarter was somewhat surprising to Dolphin Research, and it should be attributed to favorable exchange rate tailwinds.
Looking further into the reasons for the rapid growth in order volume, the core reason is the significant increase in monthly active users. It can be observed that the acceleration in the growth rate of the company's core order value corresponds perfectly with the continuous acceleration in the growth rate of monthly active users from 14% to 18% within the year 2025.
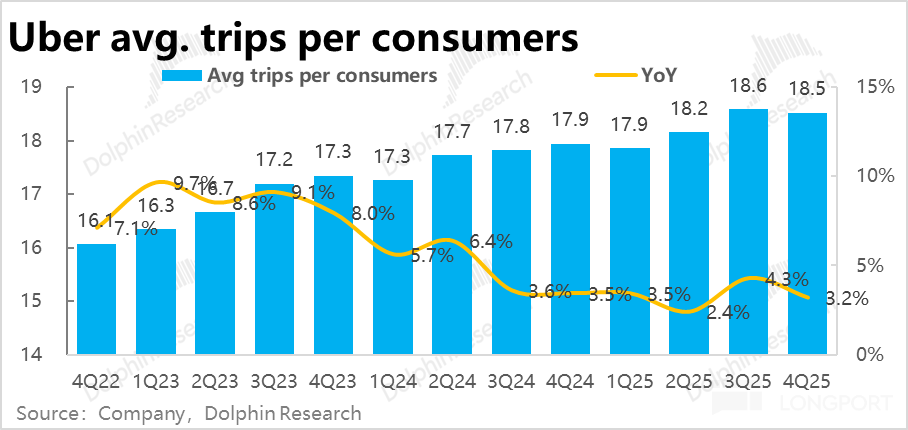
We believe that the main drivers behind the substantial increase in users on the Uber platform include: the expansion of the food delivery business from dining to non-dining categories, the ride-hailing business offering concessions & promoting market penetration in lower-tier markets, and the introduction of autonomous ride-hailing services attracting new users (the company stated that after introducing autonomous ride-hailing services in Austin and Atlanta, the growth in first-time users accelerated by 9 percentage points).
II. Ride-hailing monetization rate declines next quarter amid concessions, while food delivery continues to rise
From a revenue perspective, the ride-hailing business's monetization rate decreased by 42 basis points year-over-year this quarter, marking the first decline since 2021. This led to a slowdown in revenue growth to 18.7%, falling short of market expectations of 19.9%.
The underlying reason, as mentioned earlier, should be the company's decision to cede some profits to users to drive user penetration and growth. (There may also be a defensive motive to some extent to counter users being poached by autonomous ride-hailing services.)
In contrast, while the food delivery business is experiencing accelerated growth, its monetization rate has also steadily increased, rising by 49 basis points year-over-year this quarter. Driven by this, the revenue growth rate of the food delivery business accelerated to 29.7% (compared to 29% in the previous quarter). After excluding the impact of exchange rate fluctuations, the actual growth rate increased by 2 percentage points sequentially.
Part of the reason behind the continuous increase in the monetization rate is the improvement in advertising performance. It was disclosed that by this quarter, the annualized advertising revenue had reached $2 billion (compared to $1.5 billion in 1Q25), accounting for 1.8% of the food delivery business's order value.
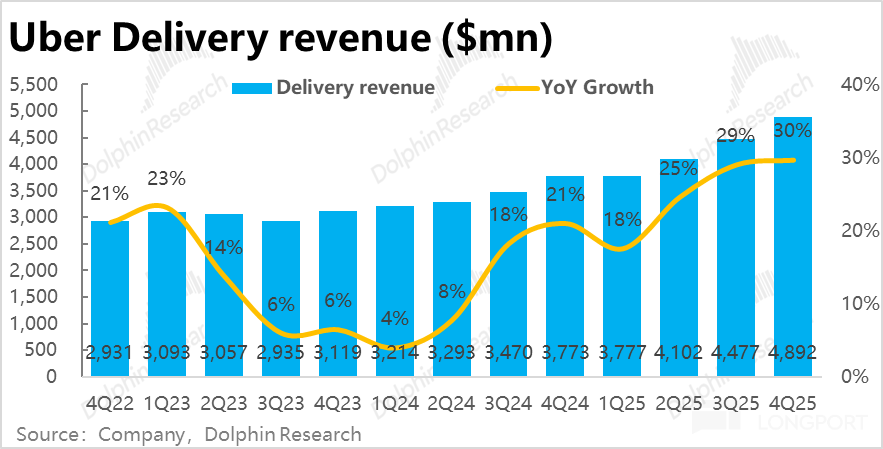
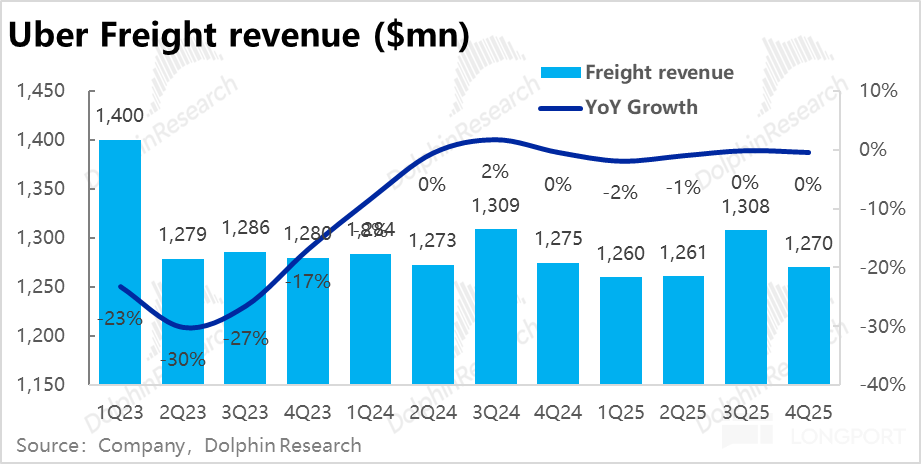
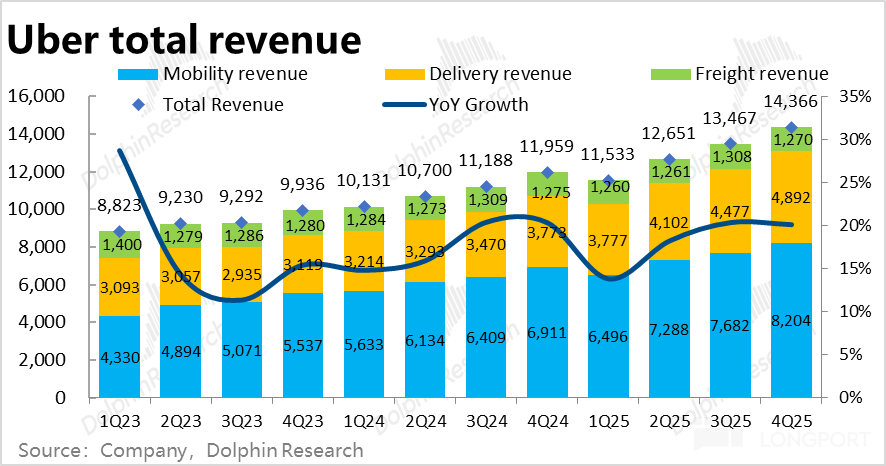
As for Uber's freight business, revenue in this quarter was approximately RMB 1.27 billion, still fluctuating within the range of RMB 1.2-1.3 billion, showing no significant changes. Summing up the various businesses, Uber's total revenue in this quarter was approximately $14.36 billion, up 20.1% year-over-year. After excluding the positive impact of exchange rates, revenue growth remained steady at 19%, slightly better than market expectations.
III. Profit margin expansion is less favorable after shifting focus to user growth
As seen from the above, Uber performed well on the growth front this quarter, driven by rapid growth in new users. However, correspondingly, to drive user growth, the profit margins of Uber's various businesses slightly underperformed expectations this quarter, although profit levels were not bad.
The group's overall adjusted EBITDA for the quarter was $2.49 billion, up 35% year-over-year, maintaining strong high growth. The profit margin (as a percentage of order value) was 4.59%, still up 42 basis points year-over-year, but fell short of market expectations of 4.77%.
Breaking it down by business segment: 1) The ride-hailing business's adj. EBITDA profit margin was 8%, down 0.1 percentage point sequentially and below market expectations of 8.1%. This should reflect proactive concessions and market penetration efforts. As a result, the ride-hailing business's profit slightly fell short of expectations this quarter.
2) As for the food delivery business, due to the continuous increase in the monetization rate and the high-profit margin of advertising revenue, the adj. EBITDA profit margin increased by another 0.1 percentage point sequentially to 4%. Although market expectations for the profit margin were higher at 4.1%, due to the significantly higher-than-expected order value, the food delivery business's profit ultimately exceeded expectations.
From a cost and expense perspective, although profit growth is still on an upward trend, it slightly fell short of expectations for the following reasons.
First, the gross profit margin for the quarter was 39.6%, slightly down from 39.8% sequentially (though still up year-over-year) and slightly below expectations (also 39.8%).
Considering that the company's insurance costs have decreased recently due to legal requirement changes, the fact that the gross profit margin still fell short of expectations suggests that the savings from insurance costs were likely reinvested into user subsidies.
Total expenses for the quarter appeared to decrease by 1% year-over-year at first glance, suggesting significant cost control effectiveness. However, this was mainly due to a one-time legal expense of $460 million in management expenses last year, resulting in a seemingly negative growth rate of 34% in management expenses. If this one-time impact is excluded, the combined expense growth rate still stands at 12%.
The year-over-year growth rates for operational support, marketing, and R&D expenses were all between 11% and 13%. Although still significantly lower than revenue growth, these rates represent a notable increase compared to the low single-digit percentage expense growth rates seen previously. Therefore, although profit margins are still increasing year-over-year, the magnitude of the increase has narrowed and slightly fallen short of expectations.
- END -
// Reprint Authorization
This article is an original piece by Dolphin Research. Reprinting is only allowed with authorization.
// Disclaimer and General Disclosure Notice
This report is for general comprehensive data purposes only, intended for general reading and data reference by users of Dolphin Research and its affiliated institutions. It does not take into account the specific investment objectives, investment product preferences, risk tolerance, financial status, or special needs of any individual receiving this report. Investors must consult with independent professional advisors before making investment decisions based on this report. Any person making investment decisions using or referring to the content or information in this report does so at their own risk. Dolphin Research shall not be liable for any direct or indirect responsibilities or losses that may arise from the use of the data contained in this report. The information and data in this report are based on publicly available sources and are for reference purposes only. Dolphin Research strives to ensure but does not guarantee the reliability, accuracy, and completeness of the information and data.
The information or opinions mentioned in this report shall not, under any jurisdiction, be construed as or deemed to be an offer to sell securities or an invitation to buy or sell securities, nor shall they constitute recommendations, inquiries, or endorsements of relevant securities or related financial instruments. The information, tools, and data contained in this report are not intended for or intended to be distributed to jurisdictions where distribution, publication, provision, or use of such information, tools, and data conflicts with applicable laws or regulations, or to citizens or residents of jurisdictions where Dolphin Research and/or its subsidiaries or affiliated companies are required to comply with any registration or licensing requirements in such jurisdictions.
This report only reflects the personal views, insights, and analytical methods of the relevant creators and does not represent the stance of Dolphin Research and/or its affiliated institutions.
This report is produced by Dolphin Research, and the copyright is solely owned by Dolphin Research. Without the prior written consent of Dolphin Research, no institution or individual shall (i) make, copy, reproduce, duplicate, forward, or create any form of copies or replicas in any way, and/or (ii) directly or indirectly redistribute or transfer to other unauthorized persons. Dolphin Research reserves all relevant rights.
-
![]()
The Surprisingly Significant Impact Difference Between Quiet and Noisy Cars!
-
![]()
Breaking Through Storage Cycle Barriers: How AI Large Models and Coding Technology Synergize to Drive Transformation in the Security Industry
-
Facilitating the Slimming of Camera Modules! O-film Obtains Utility Model Patent for Periscope-Type Reflective Component
-
![]()
Hikvision Raytine’s Millimeter-Wave Body Imaging Security Inspection Device Achieves ECAC SSc Category A Standard Level 2.1 Certification for European Civil Aviation
-
![]()
Global Market Share for Security Windows Hits 26%! This Optical 'Little Giant' Makes Its Debut on NEEQ
-
![]()
The Evolutionary Path of Agent Engineering: From Prompt to Harness by Zhang Yutao, Co-founder of Moonshot AI
-
![]()
Profits and stock prices are both declining, so why are executives from these auto companies increasing their purchases?
-
![]()
Burning Tens of Billions of Dollars, Yet No Unified Definition for World Models