Microsoft: High Investment, High Growth, Strong Cash Flow—Is It the Only Cloud Giant with True "Character" Deserving a Premium Valuation?
 11/02 2026
 487
Microsoft released its FY2027 Q1 earnings report (quarter ended September 2026) on the morning of the 29th, Beijing time. This marks the company's first earnings report under its new segment reporting structure. Overall performance was strong: both revenue and operating income beat expectations, core Azure grew 48%, surpassing guidance and buy-side expectations, and next quarter's guidance points to further acceleration; M365 commercial cloud also accelerated as anticipated.
1. Reporting Change: The First Earnings Report Under the New Segments
Starting this quarter, Microsoft consolidated its previous three business segments into two new divisions: Agents & Infra (A&I, essentially the former Productivity and Business Processes plus Intelligent Cloud) and Devices & Consumer (D&C, the former More Personal Computing, plus LinkedIn's advertising and membership businesses). GitHub and Security Copilot, previously part of Azure, were moved into M365 commercial cloud, making Azure a more "pure" cloud business under the new structure. See the notes at the end for detailed changes.
2. Overall Performance: Both Revenue and Operating Income Beat Expectations
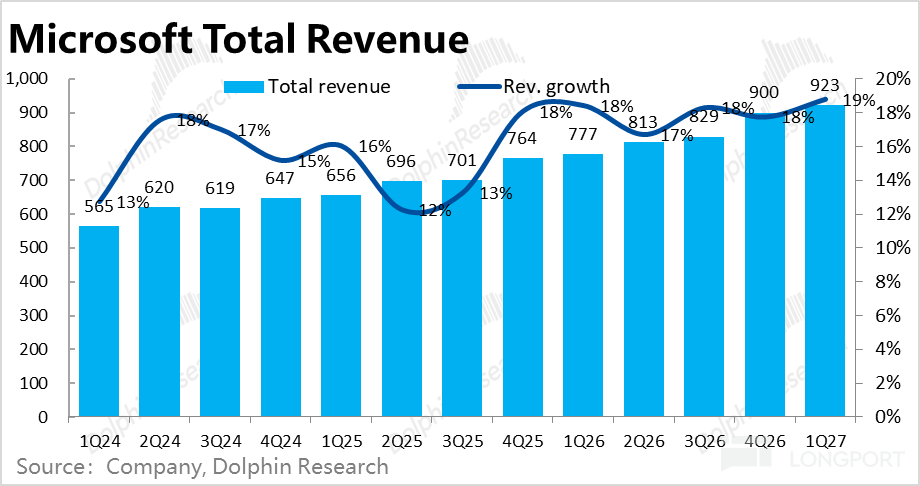
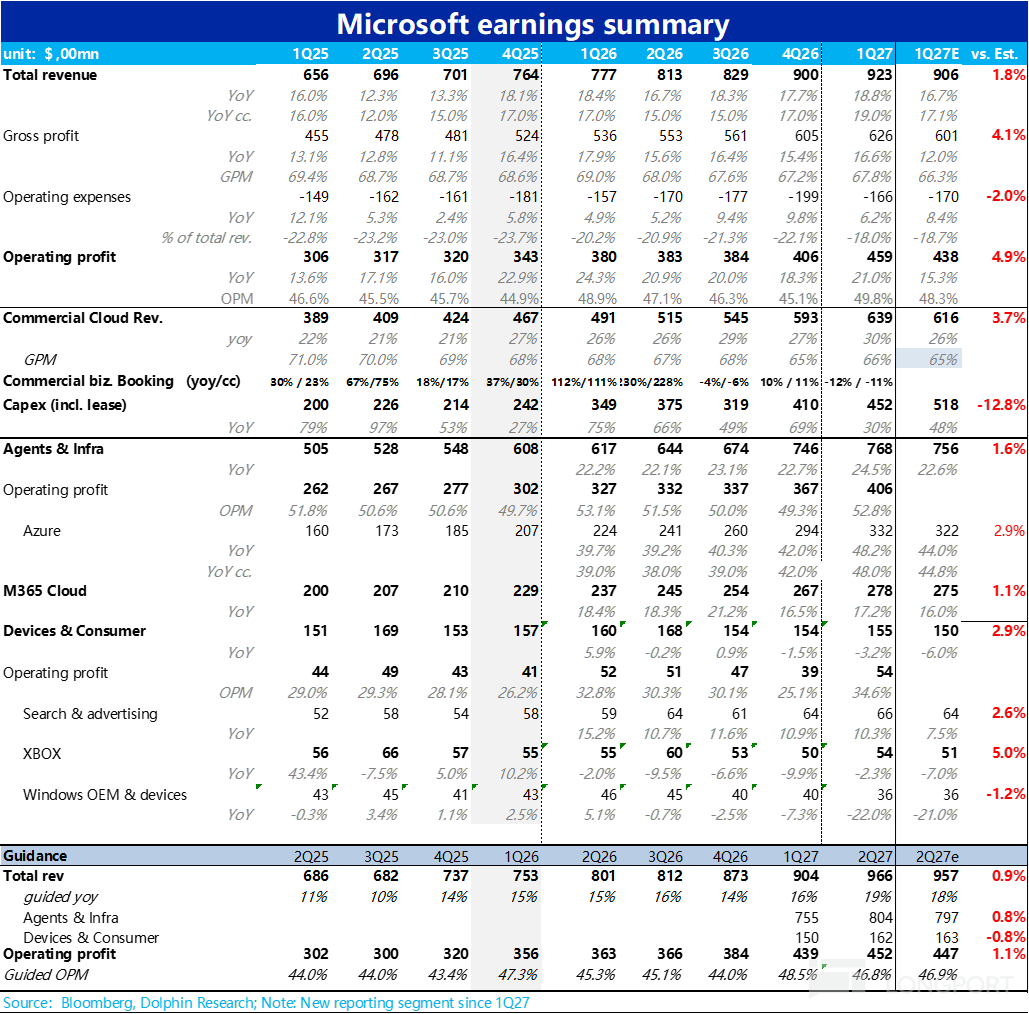
Quarterly revenue was $92.28 billion, up 18.8% year over year, about 2% above the Bloomberg consensus. Sequentially, growth accelerated by 1 percentage point this quarter, mainly driven by Azure's strong growth.
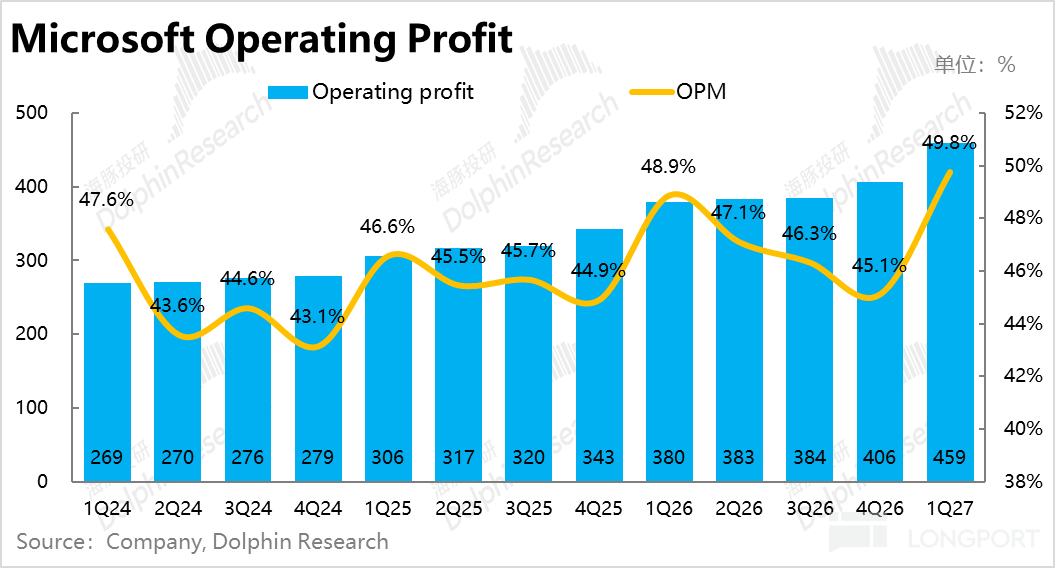
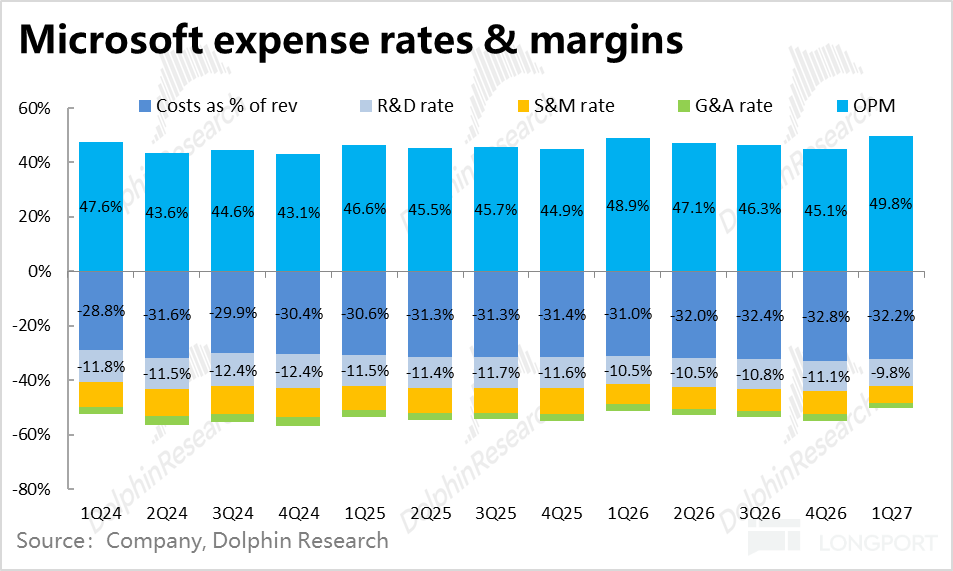
Operating income was $45.92 billion, up 21% year over year, about 5% above consensus; operating margin was 49.8%, up 0.9 pt year over year. Margins were able to rise during an investment period mainly due to excellent cost control and a smaller-than-expected decline in gross margin.
3. Agents & Infra: Azure Hits 48%, M365 Accelerates as Expected
a) Azure: Significantly Beat Guidance and Buy-Side Expectations
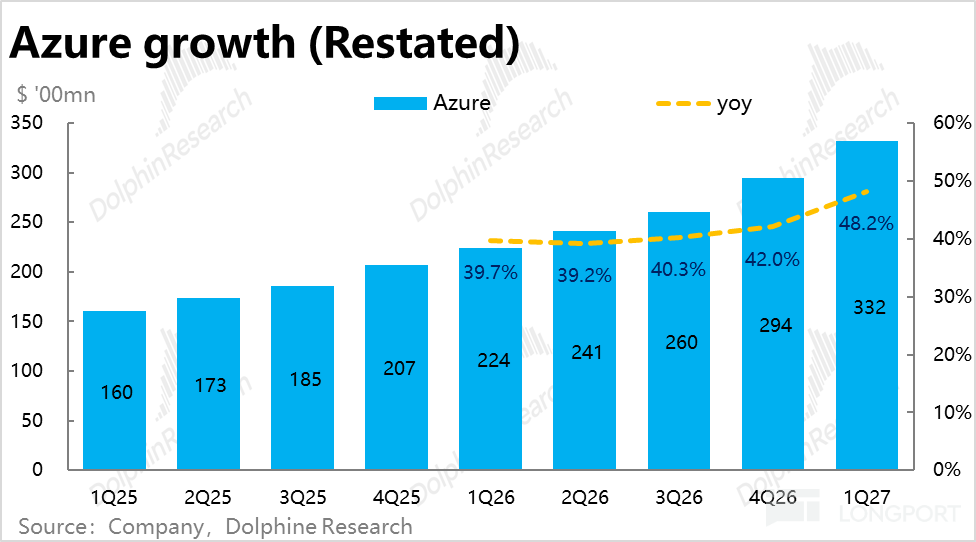
Azure revenue was $33.2 billion, up 48% year over year, far above company guidance (44%-45%) and also meeting the more demanding buy-side expectation range of 46%-48%. And this was not achieved through accounting gimmicks: based on 4Q26 data, stripping out businesses such as GitHub Copilot actually reduced Azure's growth rate by 1 percentage point.
Dolphin Research believes there are two positive drivers behind this: OpenAI's contribution. Revenue from OpenAI (including revenue sharing) reached $10 billion this quarter, about 11% of total revenue and about one-third of Azure; sell-side estimates suggest that in 4Q26 alone, revenue from OpenAI was above $8 billion, with about 90% recorded in Azure;
based on this estimate, OpenAI brought less than $1.8 billion of sequential Azure increment this quarter, contributing at most half of Azure's sequential increment (about $3.75 billion).
This corresponds to the revenue surge period following the integration of the Claude model and OpenAI. According to reports, the Claude model officially became commercially available on Foundry starting June 29. Meanwhile, after OpenAI released GPT-5.6 in July and merged Codex into ChatGPT, ARR began to accelerate. These positives were partially reflected within this quarter.
b) M365 Cloud: Accelerated as Expected
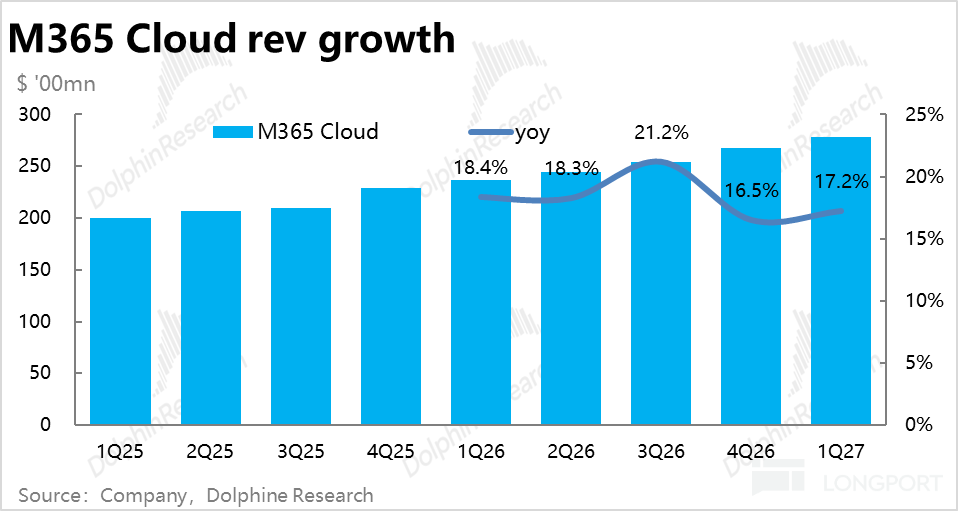
M365 commercial cloud revenue grew 17% year over year (18% excluding FX), about 1 pt above guidance and slightly faster than last quarter. This was mainly driven by higher revenue per user: Copilot, E5/E7 upgrades, price increases on packages starting in July, and GitHub Copilot switching to usage-based billing. However, commercial seat growth actually slowed to 5% (7% last quarter).
c) A&I Overall and Other Businesses
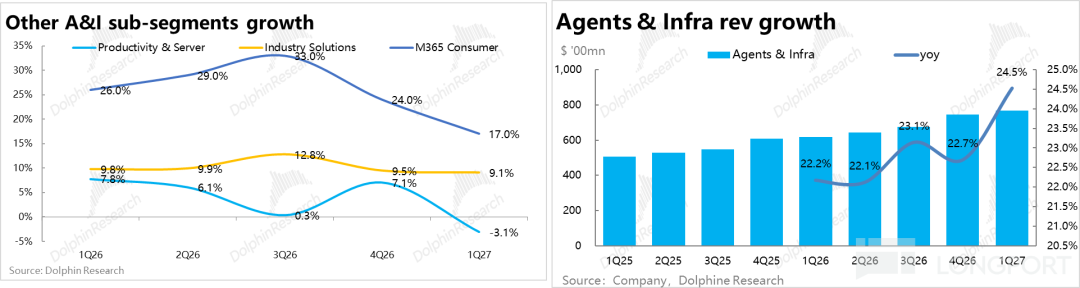
A&I segment revenue was $76.8 billion, up 24.5% year over year, about 1.6% above consensus. Among other businesses, Productivity and Server licensing was $8.4 billion, down 3.1% year over year, in line with low-single-digit decline guidance but slightly weaker than consensus (-2.2%); Industry Solutions cloud grew 10%, slightly better than high-single-digit growth guidance.
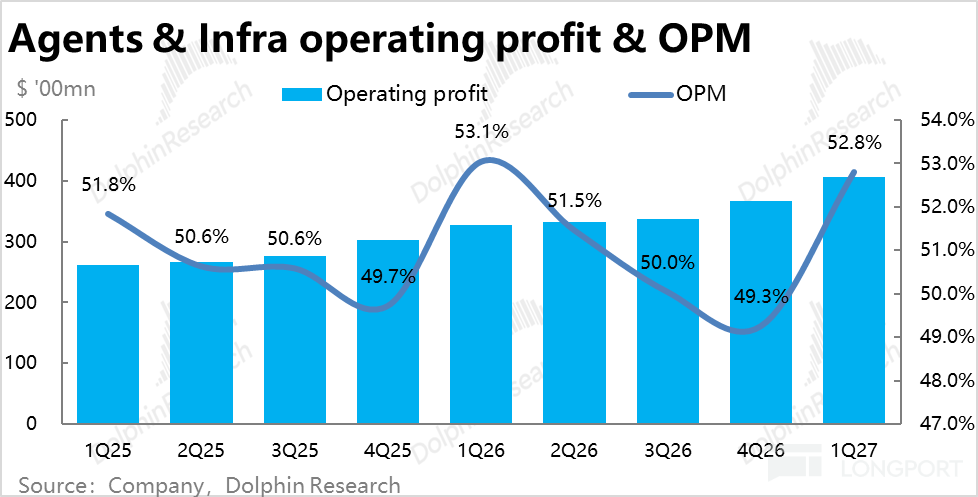
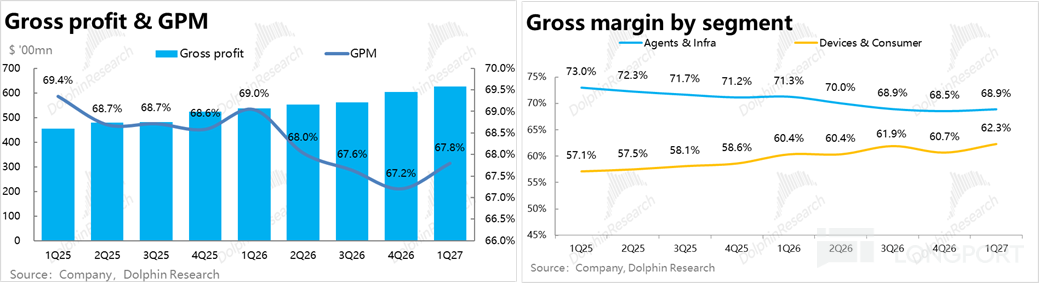
Operating income was $40.6 billion, with a margin of 52.8%, down about 0.2 pt year over year. This reflected a roughly 2.4 pt year-over-year decline in gross margin offset by a roughly 2.2 pt year-over-year decline in expense ratio. Cost control again offset gross margin pressure.
4. Devices & Consumer: Better Than Guidance, Windows Drag Deepens
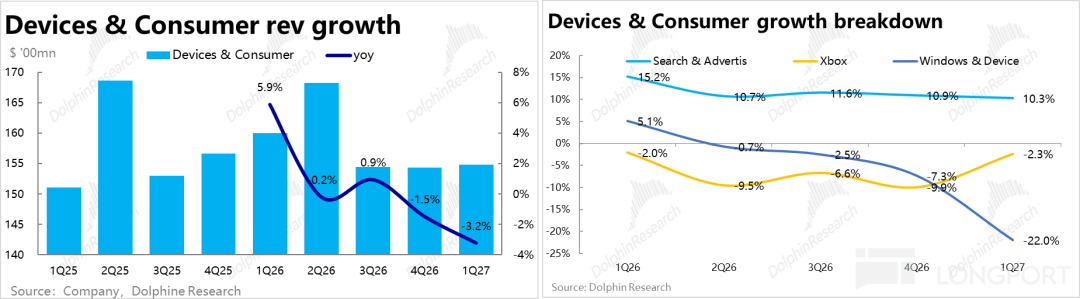
D&C revenue was $15.48 billion, down 3% year over year, about 3% above consensus. Although still weak, it was slightly better than expected.
By component, Windows was the biggest drag, while other sub-segments were slightly better than expected: Windows OEM and Devices -22%, in line with guidance of a decline of "over 20%" (tough comparison from last year's Windows 10 replacement cycle and component price increases weighing on PC demand);
Search and advertising (excluding TAC) +12%, better than mid-to-high single-digit guidance; Xbox content and services -2%, better than mid-single-digit decline guidance. Next quarter's guidance for Windows OEM and Devices is a mid-30% decline, with the drag still deepening.
Operating margin was 34.6%, up about 1.8 pt year over year.
D&C operating income was $5.36 billion, up 2% year over year. The margin improvement came almost entirely from gross margin (+2.0 pt year over year). Expense ratio was flat. Dolphin Research believes that structurally, Search and advertising rising from 37% to 42% of D&C revenue may be an important reason.
5. Capex and Cash Flow: Investment Is Actually Still Accelerating
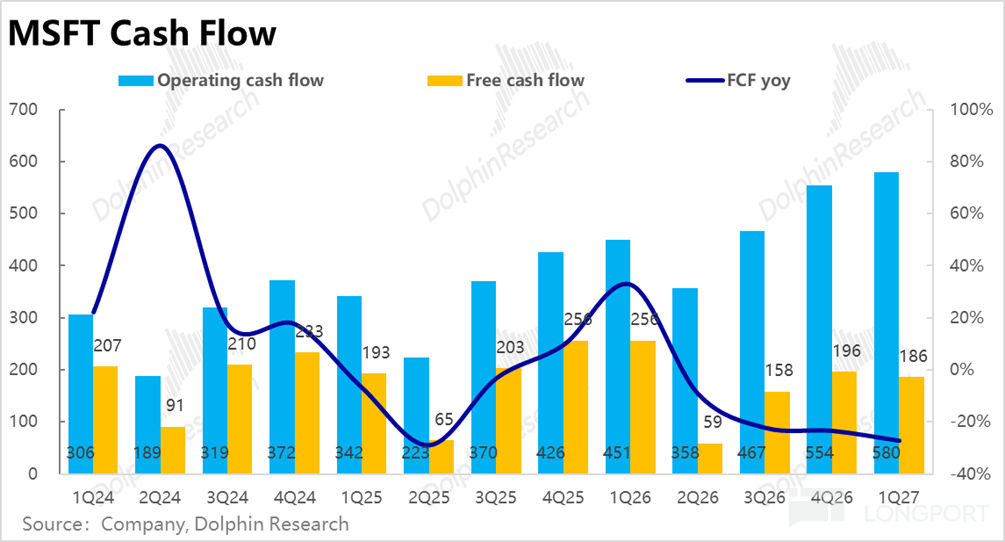
Capex (including finance leases) was $45.2 billion, up 30% year over year, representing 49% of revenue (46% last quarter), showing investment intensity continues to rise; however, it was below the company's prior guidance of "over $50 billion."
The company explained the shortfall versus guidance as delays in delivery of some third-party capacity. Another factor is accounting treatment: after extending the depreciable life of property assets to 25 years, more data center leases are classified as operating leases and excluded from capex. Adding back operating leases, actual total investment this quarter was about $51.7 billion, basically in line with guidance.
By structure, short-cycle assets (servers such as CPUs and GPUs) continued to increase as a share, rising to about three-quarters this quarter. The money was mainly spent on compute capacity that can convert into revenue faster, which is also one of the factors driving Azure's acceleration.
Next quarter's capex guidance remains "over $50 billion." On the call, the company lowered CY26 capex from about $175 billion to about $170 billion, also due to third-party capacity delays; based on this, 2Q27 capex is about $52 billion, or about 54% of revenue, basically in line with consensus (about $52.8 billion).
On cash flow, operating cash flow was $58 billion, up 29% year over year, which the company attributed to strong cloud billing and collections; free cash flow was $18.6 billion, down 27% year over year, depressed by capex. Management expects FY27 free cash flow to remain positive; the company remains the most cautious investor among the major players and will use external financing such as leases and bond issuance when conditions are appropriate to maintain flexibility. It has not issued debt yet.

6. Orders: Year-over-Year Decline, Mainly Due to High Base and Seasonality
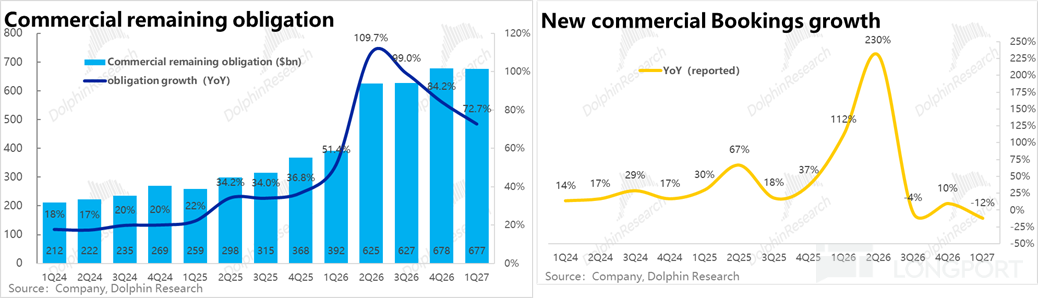
Commercial bookings were down 12% year over year (-11% excluding FX). The company explained that the prior-year period had a large Azure commitment and a high base; this quarter also signed a large Azure commitment, while other sales grew "healthily." Commercial RPO was $677 billion, up 73% year over year, basically flat sequentially versus last quarter ($678 billion).
1Q is historically a seasonally weak quarter for sequential RPO (both 1Q24 and 1Q25 declined sequentially), and this quarter's decline was very small. The portion to be recognized within the next 12 months was about 30%, up 29% year over year, slower than last quarter (37%) and below market expectations of mid-30s; the portion beyond 12 months was +98%, with large long-term contracts still the main driver.
7. Gross Margin and Expenses: Gross Margin Better Than Expected, Excellent Cost Control
Gross margin was 67.8%, down 1.3 pt year over year, but above consensus of 66.3%. The gross margin decline was mainly due to a revenue mix shift toward Azure and higher depreciation (which reached nearly 13% of revenue this quarter). The smaller-than-expected decline was mainly due to the contribution from D&C and the benefit from extending depreciable lives.
Total operating expenses were $16.64 billion, up 6% year over year, below consensus of $17 billion. Expense ratio was 18.0%, down about 2 pt year over year. By component, sales and administrative expenses were strictly controlled, while R&D spending still grew more than 10% year over year.
8. 2Q Guidance: Revenue and Profit Slightly Above Expectations, Azure Continues to Accelerate to 49%-50%
Revenue guidance is $96.0-97.1 billion, with the midpoint up 18.8% year over year, flat with this quarter's growth rate and about 1% above consensus; of which A&I is $80.1-80.7 billion (+25%), and D&C is $15.9-16.4 billion (-4%).
Azure guidance is +49%-50% excluding FX, continuing to accelerate from this quarter and also higher than buy-side expectations of 48%-49%; M365 commercial cloud is about 19% (excluding FX), also accelerating. For D&C, Windows OEM and Devices are expected to decline in the mid-30% range, and the Windows OEM drag is expected to persist throughout the year.
Based on cost and expense guidance, operating income is expected to be about $44.8-45.6 billion, with the midpoint up 18% year over year, about 1% above consensus; operating margin is expected to be about 46.8%, down about 0.3 pt year over year.
Breaking it down, gross margin is expected to be about 66%, down about 2 pt year over year, while expense ratio is expected to decline about 1.7 pt year over year, offsetting most of the impact. Cost control remains the main offset to gross margin pressure.
9. Below Is an Overview of Core Metrics; the Conference Call Transcript Can Be Found at the Link
Dolphin Research Viewpoint:
Before the earnings report, the market was already uniformly long on Microsoft with crowded positioning, and buy-side expectations for Azure and M365 had been raised very high. The most important incremental takeaway from this earnings report is that "acceleration" has been confirmed: Azure not only exceeded the buy side's optimistic expectations, but next quarter's guidance will also continue to accelerate and exceed expectations; although M365 is not particularly strong, the pace of full-year acceleration is being delivered. Revenue, profit, and guidance all came in better than expected, and the main narrative since last quarter of "dual acceleration in Azure and M365" did not falter this time.
Two points need continued attention: first, new bookings growth this quarter was not good, and whether Azure's strong growth can continue after 2Q is worth watching; second, with gross margin declining more deeply next quarter, margin turning to a small year-over-year decline, and combined with one-time costs from voluntary departures, whether the full-year target of "margin decline of less than 1pt year over year" can be maintained.
Beyond the performance itself, Dolphin also focuses on the following new changes:
1) In-House Chip Maia: From "Backup" to Main Inference Platform
On October 12, Microsoft announced that starting in 2027 it will expand the Maia series to multi-GW-level deployment and make it the main inference platform for its own products and services.
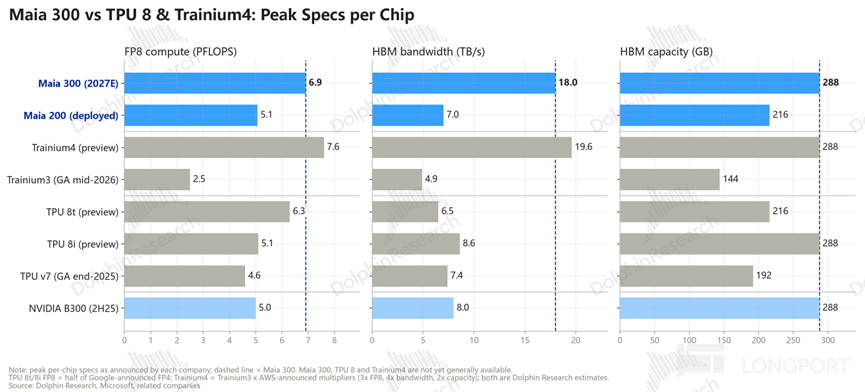
At peak specifications, Maia 300's FP8 compute (6.9 PFLOPS) and HBM bandwidth (18TB/s) are significantly higher than Google TPU v7 and AWS Trainium3. But this is a comparison across different generations; compared with the actual next-generation competitors, it is broadly between TPU 8 and TRN4. If actual performance matches the paper specifications, it means Microsoft has also caught up to the first tier in ASIC chips.
Currently Maia is used only internally and is not rented externally, mainly to reduce the unit cost of 1P applications such as Copilot; over the long term it helps raise the gross margin of AI compute.
Maia 300 is planned to enter production in 2027. According to industry estimates, by early 2027 Maia will account for only about 10% of Microsoft's chip spending, and in the short term it will still mainly rely on Nvidia and AMD.
2) New Copilot "Super App": From Selling Seats to "Seats + Usage"
On September 25, Microsoft rolled out its largest Copilot update to date: it merged Chat, Cowork for multi-step task handling, and Word/Excel/PPT into a single entry point, and added Code, enabling business users to build small tools and workflows using natural language.
The update also introduced Autopilot, a digital colleague that runs persistently in the background with its own identity and memory—similar to Meta's Muse but geared more toward workflows. The underlying layer is not tied to any single model; by default, Auto mode automatically routes across models such as OpenAI, Claude, and the in-house MAI based on quality, speed, and cost.
Pricing has accordingly shifted to a hybrid "seats + usage" model: everyday AI is still charged by seat (list price $30/month, with channel estimates putting actual transaction at about $21), but with a usage cap; Cowork, Code, Autopilot, the latest frontier models, and usage above the cap are billed by usage.
Logically, this raises Copilot's revenue ceiling from "headcount" to "workload," and default routing to cheaper models also helps gross margin.
The early signals given on the earnings call were encouraging: Copilot DAU grew nearly 50% quarter over quarter. Channel research, however, suggests it will take more than six months for these adjustments to be clearly reflected in revenue.
3) OpenAI revenue share: how large, and how long can it last?
The agreement revised in April stipulates that OpenAI will pay Microsoft a revenue share at the original ratio until 2030, but with a total cap. The company has never disclosed the share ratio, and media reports put it at about 20%. As for the cap, some sell-side sources say management confirmed during September communications that it was $38 billion.
Note, therefore, that once the OpenAI share reaches the cap, Azure's revenue from OpenAI will come only from the compute OAI actually uses and the channel share—rather than a share of OAI's total revenue—which may cause growth to slow abruptly.
4) Compute pricing: from more than a decade of price cuts to broad price increases
In early October, Microsoft notified customers that starting February 1, 2027, virtual machines and storage in seven regions across Europe and Southeast Asia will increase in price by 8%–17% (up to 17% in the Nordic and Dublin regions), and global prices for older v1/v2 models will rise by about 25%.
All of this means that subsequent Azure growth will have more support from price increases: with third-party capacity delayed this quarter and Azure still able to greatly exceed expectations, compute freed up by engineering efficiency and better pricing are key.
On the other hand, Nadella recently warned that compute in most enterprise scenarios will eventually become commoditized, and there will certainly be brutal price competition at the underlying layer; combined with large intra-quarter changes in token pricing, how long this round of price increases can last remains to be seen.
Overall, Dolphin's analytical framework for Microsoft and other cloud giants is "compute (cloud revenue) + models + in-house chips." Previously, due to deteriorating relations with OpenAI, Azure's growth had stalled for several consecutive quarters, and Microsoft was comprehensively behind on in-house chips and models, making it the most bearish of the three major cloud giants.
Now all three lines are improving: on compute, Azure has accelerated significantly for consecutive periods; on models, Claude has been introduced, and OpenAI's ARR has accelerated again; on chips, Maia 300's paper specifications have caught up with Google's and Amazon's next-generation products. Microsoft has returned to the first tier in all three directions, and this reversal has naturally attracted capital inflows.
Looking ahead, based on company guidance and the uplift from Azure pricing—and with most current Capex being equipment that can quickly convert into revenue—Azure's revenue growth in the medium term should be secure; even if it does not continue to rise further, maintaining the current level should not be a major problem.
On the profit side, the recent voluntary departure program for about 60,000 employees can continue to help the company offset the impact of investment and depreciation through cost control; in-house chips will also help reduce costs over the medium and long term, and at the very least maintaining margins without obvious deterioration should not be a problem.
Another advantage is cash flow: while also investing heavily in AI, Microsoft has the best cash flow control among the major giants and currently has no financing plans. It has not yet issued debt for AI investment; by contrast, Google and Amazon had negative free cash flow in the second quarter, and Meta's third-quarter free cash flow was also negative, prompting it to announce large-scale equity financing. When the market begins to reward "AI investment that generates cash" and punish "cash-burning investment," the absence of additional financing pressure is itself a kind of premium.
Earnings forecast adjustments: this time we have switched the model to the new segment basis. On the revenue side, we mainly raised the growth assumptions for Azure and M365 commercial cloud: FY27 Azure about +48%, FY28 slightly slowing to about +42%; M365 commercial cloud FY27 about +19%.
On the profit side, FY27 gross margin falls to about 66.2% in line with guidance, expenses grow about 8%, and operating margin is about 47.0%; after adjustment, FY27 revenue is $395.9 billion and operating profit is $186.1 billion.
Note: changes in financial reporting basis
On September 2, Microsoft officially announced that starting from fiscal year 2027 it will adjust its financial reporting structure again: the original three segments of Productivity and Business Processes (PBP), Intelligent Cloud (IC), and More Personal Computing (MPC) will be merged into two new segments: "Agents & Infra" (A&I) and "Devices & Consumer" (D&C).
The new A&I segment is basically the combination of the original PBP and IC, bringing together enterprise-facing SaaS applications, agents, and the underlying Azure infrastructure. D&C is basically the original MPC plus advertising and membership businesses under LinkedIn.
The more detailed changes are mainly as follows:
① Azure discloses dollar revenue for the first time, and the basis becomes "purer." GitHub cloud services (including GitHub Copilot) and Security Copilot have been moved from Azure to M365 commercial cloud. Adjusted Azure is a purer usage-based platform and compute business, with FY26 revenue of about $101.9 billion, up 40% year over year.
② M365 cloud becomes a big bucket of "applications + agents." In addition to the original Office, EMS, and Windows commercial cloud, M365 commercial cloud newly includes GitHub cloud services and Security Copilot, and commercial seat counts also begin to include paid GitHub seats. Because GitHub Copilot's revenue surged after switching to usage-based billing in June, the new M365 commercial cloud growth rate will be significantly higher than the old basis (16% vs. 14% in 4Q26).
In Dolphin's view, this change brings both gains and losses for investors:
Gains: Azure discloses dollar revenue for the first time, and the basis becomes a purer usage-based indicator, allowing incremental revenue and scale to be compared more directly with other cloud vendors; the basis shift itself also reveals information: after GitHub was moved out, Azure growth was lowered, and after it was moved in, M365 growth was raised, indicating that GitHub's growth is faster than Azure overall.
Losses: visibility into margins declines, and this is the biggest cost. A&I accounts for about 80% of revenue and nearly 90% of operating profit, mixing high-margin SaaS-like businesses with high-capex, high-depreciation cloud infrastructure. The suppression of margins by Capex that the original IC segment could separately reflect is now submerged in A&I's overall margin.
- END -
// Reprint authorization
This article is an original article by Dolphin Research. For reprinting, authorization must be obtained.
// Disclaimer and general disclosure notice
This report is intended only for general comprehensive data use, aimed at general reading and data reference by users of Dolphin Research and its affiliates, and does not take into account the specific investment objectives, investment product preferences, risk tolerance, financial condition, and special needs of any person who receives this report. Investors must consult independent professional advisers before making investment decisions based on this report. Anyone who makes investment decisions due to the use of or reference to the content or information mentioned in this report must bear the risk themselves. Dolphin Research shall not be liable for any liability or loss that may be directly or indirectly caused by the use of the data contained in this report. The information and data contained in this report are based on publicly available materials and are for reference only. Dolphin Research strives for but does not guarantee the reliability, accuracy, and completeness of the relevant information and data.
The information mentioned or views expressed in this report shall not be regarded or deemed in any jurisdiction as an offer to sell securities or an invitation to buy or sell securities, nor do they constitute advice, inquiry, or recommendation regarding relevant securities or related financial instruments. The information, tools, and materials contained in this report are not intended or intended for distribution to citizens or residents in jurisdictions where the distribution, publication, provision, or use of such information, tools, and materials conflicts with applicable laws or regulations, or causes Dolphin Research and/or its subsidiaries or affiliates to be required to comply with any registration or licensing requirements in such jurisdictions.
This report reflects only the personal views, opinions, and analytical methods of the relevant creators and does not represent the position of Dolphin Research and/or its affiliates.
This report is produced by Dolphin Research, and the copyright belongs solely to Dolphin Research. Without the prior written consent of Dolphin Research, no institution or individual may (i) produce, copy, reproduce, reprint, forward, or distribute in any form any copies or reproductions in any way, and/or (ii) directly or indirectly redistribute or transfer them to other unauthorized persons. Dolphin Research reserves all relevant rights.
-
![]()
Competing for the 2026 Auto Sales Crown Is No Longer Important
-
![]()
Xiaomi Invests 1.7 Billion Yuan for Stake in Sunwoda Power: Automakers Shift from "Buyers" to "Co-Definers"
-
![]()
Microsoft: High Investment, High Growth, Strong Cash Flow—Is It the Only Cloud Giant with True "Character" Deserving a Premium Valuation?
-
![]()
Zhuoyu Hands "Pay Stubs" to 40-Ton Trucks: Saving 20,000–30,000 Yuan in Fuel a Year—But Who Foots the Bill?
-
![]()
Building a "Chicken Farm" Together: Co-Building Charging Piles Becomes an Industry Trend
-
![]()
Computing Power Is No Longer the Ceiling for AI Agents—the Ecosystem Wall Is
-
![]()
BYD: Trading Price for Volume at Home, and Its Overseas "Savior" Is Starting to Falter Too?
-
![]()
The Vanished "Golden September and Silver October"