SMIC: Defying the Odds, Is It the 'Beacon of Hope' for China’s Domestic AI Chip Industry?
 02/11 2026
 486
486
On the evening of February 10, 2026 (Beijing Time), SMIC released its fourth-quarter financial report for 2025 (covering the period ending December 2025) after the close of the Hong Kong stock market. Key highlights include:
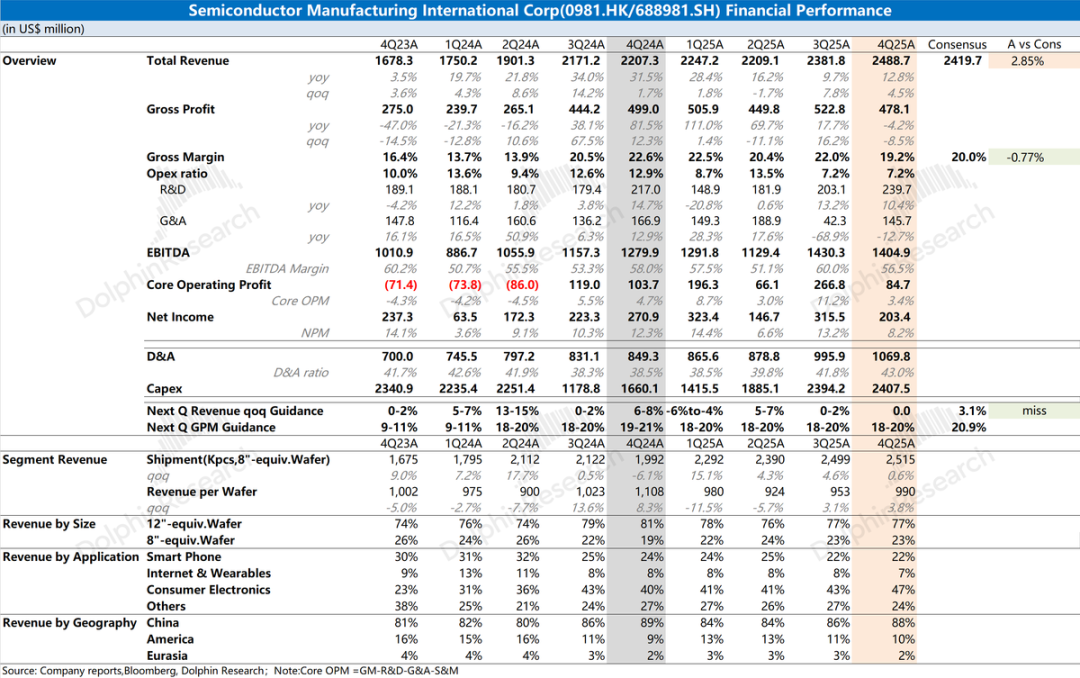
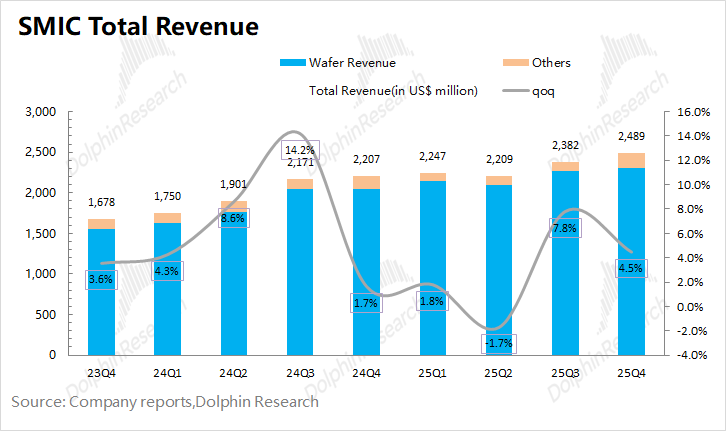
1. Overall Performance: SMIC reported fourth-quarter 2025 revenue of $2.49 billion, meeting market expectations of $2.42 billion and achieving a 4.5% quarter-over-quarter (QoQ) increase, surpassing the guidance range of 0-2% QoQ growth. This sequential revenue growth was primarily driven by increased inventory demand in the consumer electronics sector.
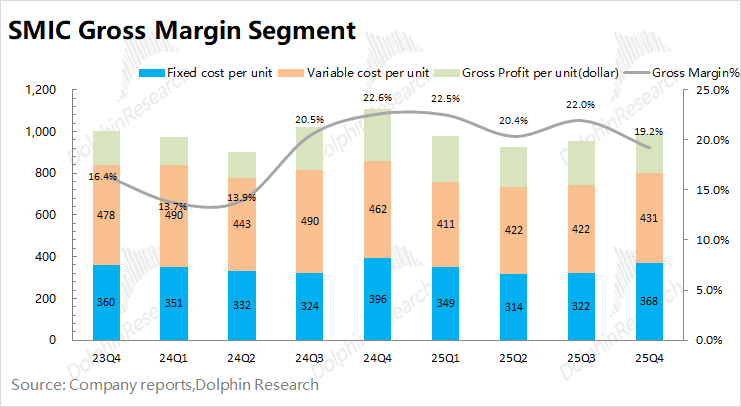
The company's gross margin for the fourth quarter of 2025 stood at 19.2%, within the guidance range of 18-20%. The decline in gross margin was mainly attributable to the low yield rates of SMIC's advanced processes (equivalent to 7nm), which impacted profitability.
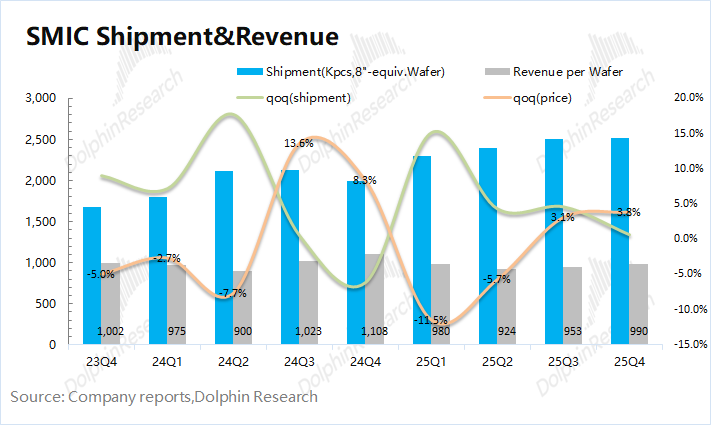
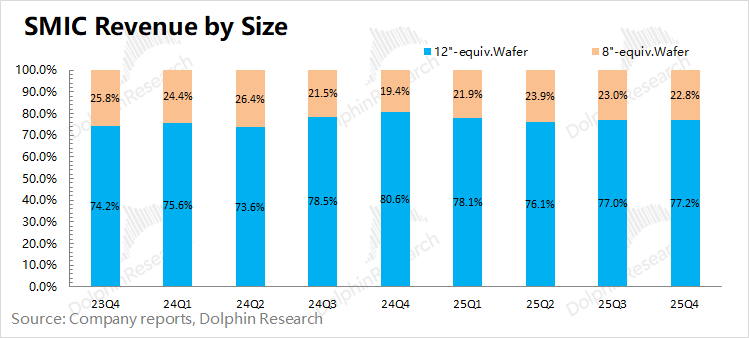
2. In-Depth Analysis of Three Core Metrics: Revenue, Gross Margin, and Capacity Utilization: Breaking down revenue by volume and price, SMIC's revenue growth in this quarter was primarily driven by an increase in average selling prices (ASPs). The proportion of 12-inch wafer shipments increased this quarter, structurally driving the recovery of product ASPs. Product shipments rose slightly by 0.6% QoQ, while ASPs increased by 3.8% QoQ.
3. Business Progress: Fueled by domestic substitution efforts, nearly 90% of SMIC's revenue in this quarter came from the China region. Consumer electronics revenue grew by 10% QoQ, led by downstream inventory demand for smart compact electronic products, becoming the primary growth driver this quarter.
Consumer electronics products have now become SMIC's largest revenue source, accounting for nearly 50%. Smartphones' share has declined to around 20%. Despite rising memory prices, the smartphone segment continues to weigh on the company's performance.
4. Expense and Capital Expenditure: SMIC's operating expenses mainly consist of R&D and administrative expenses. R&D expenses increased by 10% year-over-year (YoY) this quarter, reflecting continued investment in research and development. Administrative expenses decreased by 12% YoY, primarily due to reduced factory setup-related expenditures.
Capital expenditures for the quarter reached $2.4 billion, suggesting full-year capital expenditures of $8.1 billion, up 11% YoY, outperforming the company's previous guidance of flat YoY growth. Despite the relative sluggishness in traditional semiconductors, SMIC continues to increase capital investments for capacity expansion and technological upgrades.
5. Guidance for Next Quarter: SMIC expects revenue to remain flat QoQ in the first quarter of 2026, corresponding to $2.49 billion, below market expectations of $2.5 billion. Gross margin is projected at 18-20%, lower than market expectations of 21%.
Dolphin Research's Overall View: Sustained Mass Production of AI Chips is Key to Confidence
SMIC's performance this quarter was mediocre. While revenue met market expectations, gross margin performance was 'subpar'.
Breaking down gross margin, SMIC's product ASP increased by $37 per wafer this quarter, while unit costs rose by $56 per wafer, directly causing the decline in gross margin. Although the company has advanced its advanced process capabilities to the equivalent of 7nm, low yield rates continue to suppress gross margins.
Compared to this quarter's results, next quarter's guidance is more critical, and the company's outlook remains 'cautious'. Revenue is expected to remain flat QoQ, below market expectations of 3% QoQ growth. Gross margin guidance for next quarter remains at 18-20%, below market expectations of 21%. Conservative guidance indicates that low yield rates for advanced processes continue to weigh on gross margins.
Beyond this quarter's operating data, key areas of focus for SMIC include:
a) Capital Expenditures and Capacity: Capital expenditures for the quarter were $2.4 billion, with full-year capital expenditures reaching $8.1 billion, up 11% YoY, outperforming company guidance of flat YoY growth.
Despite the traditional semiconductor market not yet fully recovering, SMIC maintains a gross margin around 20% but continues to invest $7-8 billion annually in capital expenditures, pursuing 'counter-cyclical expansion'.
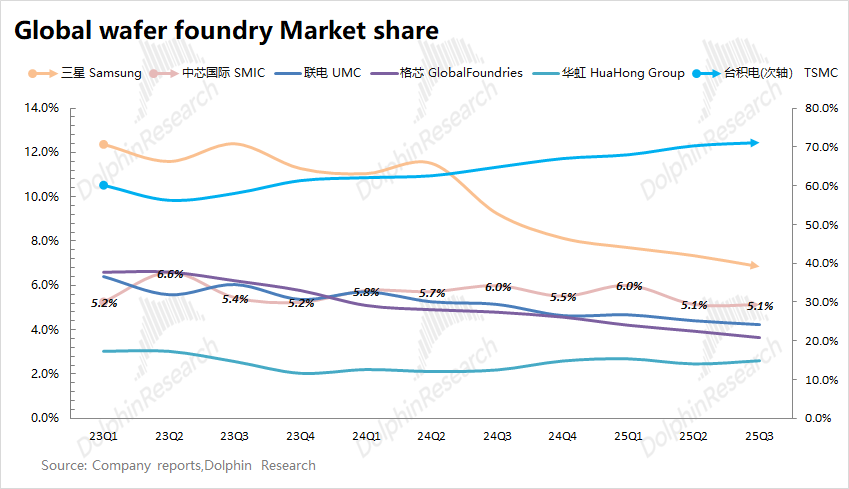
Driven by sustained high investments, SMIC's quarterly wafer capacity has reached 2,515 thousand wafers (equivalent to 8-inch wafers). The increase in capacity primarily meets domestic customer demand, with the company now firmly ranked third globally in the wafer foundry market.
b) Gross Margin and Cash Flow: At a gross margin around 20%, SMIC's annual operating profit is approximately $1 billion. Even after adding back $3-4 billion in annual depreciation and amortization, the company's cash flow struggles to cover $7-8 billion in annual capital expenditures. [Free Cash Flow = After-Tax Operating Profit + Depreciation & Amortization - Increase in Working Capital - Capital Expenditures]
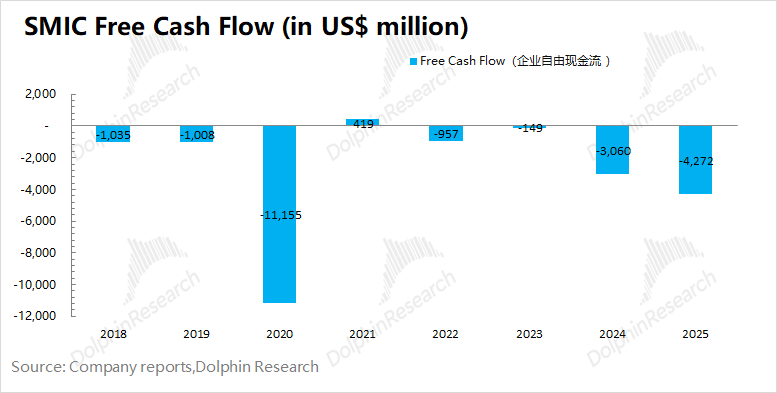
Historically, SMIC has only achieved positive free cash flow once (in 2021). During the 2021 semiconductor upcycle, gross margins exceeded 30%, and the company reduced capital expenditures, leading to positive free cash flow.
Considering only after-tax operating profit, depreciation & amortization, and $7-8 billion in annual capital expenditures, the company's funding gap will only close when gross margins steadily recover to around 28% by 2028.
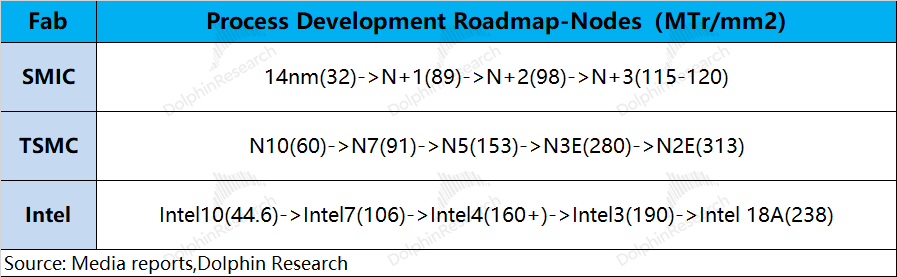
c) Competitiveness and Process Advancements: SMIC now firmly ranks in the second tier of wafer foundries, alongside UMC and GlobalFoundries, but remains the only one striving to break into the first tier.
Combining company and industry information, despite lacking EUV equipment, SMIC uses 'multi-patterning techniques' to iterate and upgrade processes like N+1 and N+2. The transistor density of N+2 is equivalent to around 7nm, while N+3 approaches TSMC's N7+ level.
Based on SMIC's current market capitalization (HK$572.4 billion), it roughly corresponds to a 2026 after-tax core operating profit multiple of around 70x PE (assuming +19% YoY revenue growth, 20.6% gross margin, and 6.7% tax rate). The company's PE is significantly high, requiring future gross margin improvements and earnings growth to justify.
While SMIC's revenue scale is comparable to UMC and GlobalFoundries, it lags behind the first tier in process nodes but leads the other two. From a PB perspective, current wafer foundry PB ratios are roughly 'TSMC 10.7 > SMIC 3.5 > GlobalFoundries 2.1 > UMC 2'.
Among these, TSMC has the highest PB (PEG < 1) due to its heavy investment in advanced processes, giving it a clear leading edge amid sustained AI demand.
Domestic and international investors hold markedly different views on SMIC. Chinese domestic securities firms are uniformly 'bullish', while foreign firms like JP Morgan maintain a long-term 'bearish' stance.
This is primarily because: (1) Chinese domestic capital adopts a 'strategic national support' mindset, choosing 'long-term companionship'; (2) Without achieving 'self-sufficiency', overseas funds see no need for strategic holding. Additionally, overseas investors have no shortage of peers like TSMC and UMC to invest in, while investing in SMIC entails currency and political risks.
Overall, SMIC's current performance is not the focal point. As China's strongest player in 'advanced process' semiconductor manufacturing, SMIC cannot afford to 'rest on its laurels' like UMC or GlobalFoundries. Despite EUV restrictions, the company relentlessly pursues technological upgrades to N+2 and N+3 processes.
While second-tier players like UMC have halted at the 14nm node, SMIC has achieved capabilities equivalent to 7nm. As long as advanced processes can achieve mass production and domestic AI clients (like Cambrian) sustain demand, SMIC remains the sole wafer foundry supplier in China's AI industrial chain, justifying its premium PB valuation compared to peers (UMC, GlobalFoundries, etc.).
Below is a detailed analysis:
I. Core Metrics Analysis: Revenue, Gross Margin, and Capacity Utilization
In Q4 2025, SMIC achieved revenue of $2.49 billion, up 4.5% QoQ, outperforming guidance of 0-2% QoQ growth. Growth was primarily driven by inventory demand in the consumer electronics market (smart compact electronic products).
A detailed analysis of volume and price drivers for SMIC's revenue growth this quarter:
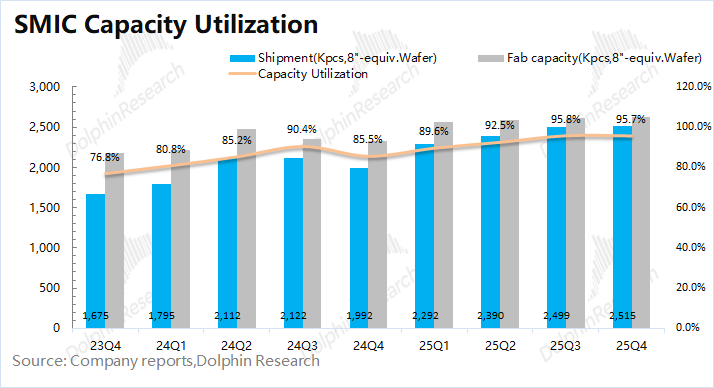
1) Volume: SMIC's wafer shipments (equivalent to 8-inch) reached 2,515 thousand units, up 0.6% QoQ.
2) Price: SMIC's revenue per wafer (equivalent to 8-inch) was $990, up 3.8% QoQ.
Breaking it down: Driven by high capital expenditures, both capacity and output increased. The recovery in product ASPs this quarter was primarily due to a higher proportion of 12-inch wafers, structurally boosting ASPs.
Looking ahead to Q1 2026, SMIC guided for flat revenue QoQ ($2.49 billion), below market expectations of 3% QoQ growth. Given industry conditions, Dolphin Research believes cautious inventory management in markets like smartphones reflects ongoing weakness in traditional semiconductor demand.
Core Metric 2: Gross Margin
SMIC's gross margin was 19.2% in Q4 2025, down 2.8 percentage points QoQ and below market expectations of 20%.
A cost structure breakdown reveals the drivers of SMIC's gross margin changes this quarter:
Gross Profit per Wafer = Revenue per Wafer - Fixed Cost per Wafer - Variable Cost per Wafer
1) Revenue per Wafer: SMIC's revenue per wafer (equivalent to 8-inch) was $990, up $37 QoQ.
2) Fixed Cost per Wafer (Depreciation & Amortization): Fixed cost per wafer (equivalent to 8-inch) was $368, up $47 QoQ. Depreciation & amortization reached $927 million, up 15% QoQ, primarily due to sustained capital expenditures.
3) Variable Cost per Wafer (Other Manufacturing Expenses): Variable cost per wafer (equivalent to 8-inch) was $431, up $9 QoQ. The higher proportion of 12-inch wafers and advancements in advanced processes drove up variable costs.
4) Gross Profit per Wafer: SMIC's gross profit per wafer (equivalent to 8-inch) was $190, down $19 QoQ.
Cost breakdowns show that the decline in unit gross profit was due to ASP increases failing to cover rising unit costs, pushing gross margins below 20%.
Looking ahead to Q1 2026, SMIC guided for a gross margin of 18-20%, below market expectations of 21%. Persistently muted guidance reflects the company's 'relatively sluggish' outlook for the traditional semiconductor market.
Combining industry conditions, SMIC's gross margins will remain under pressure due to: (1) a projected 15% decline in smartphone shipments in 2026 amid memory shortages; (2) rising fixed costs from sustained capital expenditures; and (3) ongoing low yield rates for advanced processes.
At this stage, advancing advanced processes 'at all costs' and accepting 'low yield rates' is tolerable if it means meeting domestic AI chip demand through mass production.
Core Metric 3: Capacity Utilization
Capacity utilization reflects not only SMIC's quarterly performance but also broader trends in the wafer foundry industry. During semiconductor downturns, monitoring capacity utilization helps grasp supply-demand dynamics for the company and industry.
SMIC's capacity utilization was 95.7% in Q4 2025, remaining high.
Calculating capacity utilization and shipments, SMIC's total capacity reached 2,628 thousand wafers (equivalent to 8-inch), up 0.7% QoQ. Capital expenditures of $2.4 billion this quarter brought full-year capital expenditures to a record $8.1 billion, demonstrating the company's commitment to expansion.
Combining gross margin and capacity utilization, SMIC has emerged from its 'trough' but has not yet fully recovered. While capacity utilization has returned to relatively high levels, the absence of 'shortages -> price hikes' keeps gross margins around 20%.
II. SMIC from a Business Perspective
After reviewing the three core indicators, Dolphin Research will provide a comprehensive analysis of SMIC's quarterly business performance alongside you:
2.1 Downstream Market Analysis
The consumer electronics segment remained SMIC's largest revenue contributor this quarter, with its share rising to 47%, primarily driven by restocking demand for consumer electronics products (small electronic devices).
SMIC's smartphone
2.3 Analysis of Regional Distribution
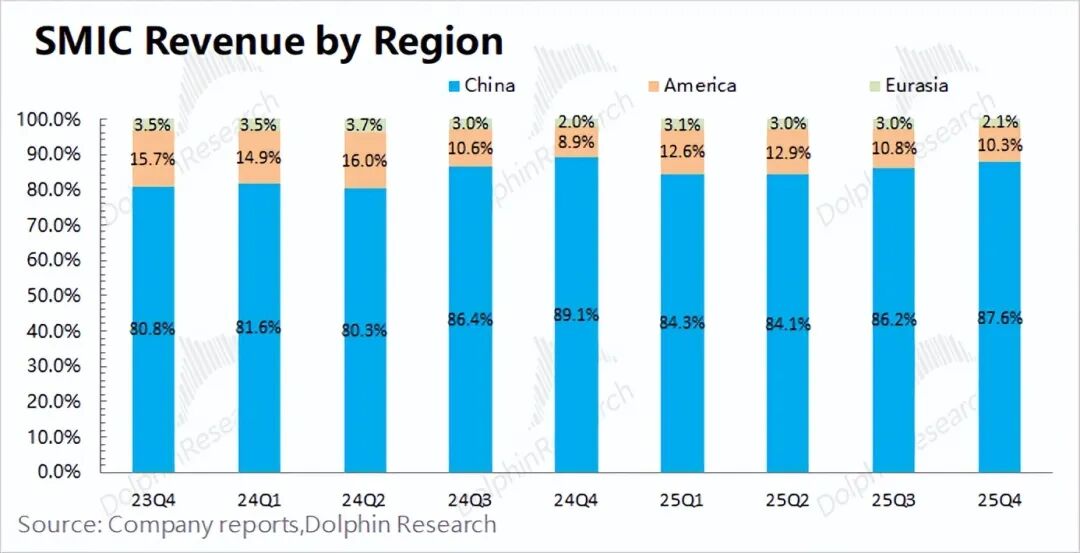
SMIC has updated its regional revenue reporting structure, transitioning from the former "North America/Mainland China & Hong Kong/Europe & Asia" framework to the current "China Region/U.S. Region/Eurasia Region." This change has resulted in minor variations in the reported data.
During this quarter, the China Region maintained its position as SMIC's primary revenue generator, contributing 88% of the total revenue. Meanwhile, the U.S. Region and Eurasia Region accounted for 10% and 2% of the revenue, respectively.
In particular, SMIC's revenue in the China Region reached US$2.18 billion this quarter, marking a 6% increase from the previous quarter. This growth was primarily driven by heightened demand for consumer electronics, such as small electronic devices, in the domestic market. With nearly 90% of the company's revenue now stemming from the Chinese domestic market, the "demand for localization and domestic substitution" has emerged as the key driver of SMIC's performance.
III. SMIC: An Operational Data Perspective
3.1 Operating Expenses
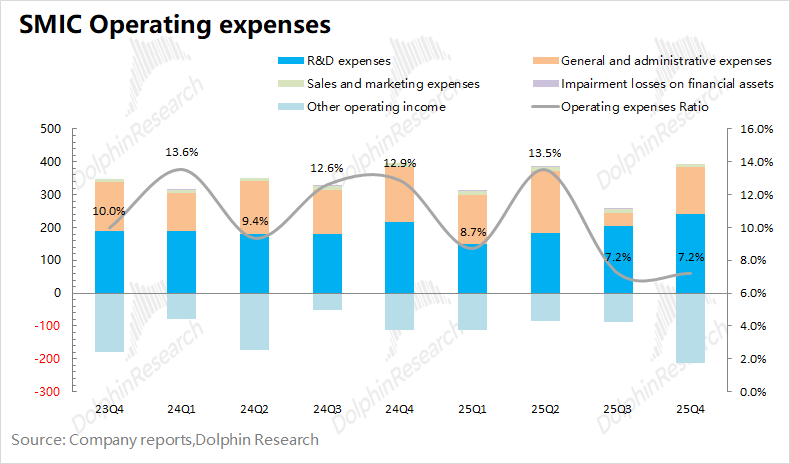
From the standpoint of operating expenses, SMIC incurred US$180 million in expenses this quarter, a figure significantly influenced by increased government subsidies. As a result, operating expenses remained relatively low, constituting 7.2% of the total.
A detailed breakdown of this quarter's operating expenses reveals that research and development expenses amounted to US$240 million, general and administrative expenses were US$150 million, and sales and marketing expenses totaled US$8 million. The company's core expenses exhibited relative stability. The decrease in general and administrative expenses observed last quarter was primarily attributable to reduced expenditures associated with factory setup.
3.2 Operational Metrics
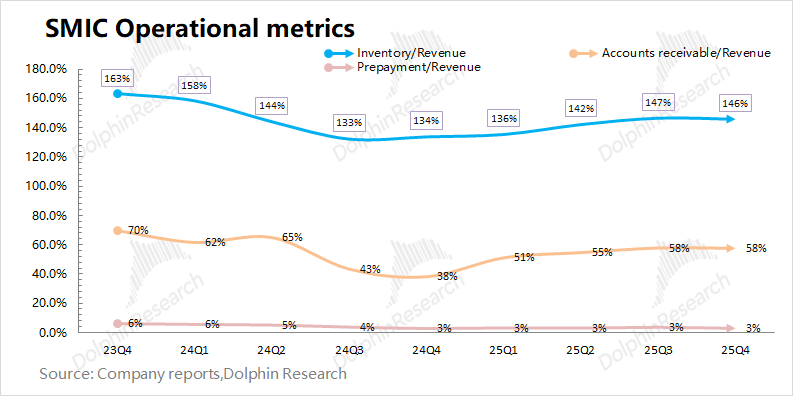
When examining operational metrics, our focus lies on the company's inventory and accounts receivable:
1) SMIC's inventory reached US$3.63 billion this quarter, reflecting a 4% increase from the previous quarter; 2) The company's accounts receivable stood at US$1.43 billion, also up by 4% quarter-on-quarter.
Considering the interplay between inventory, accounts receivable, and revenue as depicted in the balance sheet, the inventory-to-revenue and accounts receivable-to-revenue ratios for this quarter were 146% and 58%, respectively. From an operational perspective, SMIC's inventory proportion remained stable and within a reasonable range.
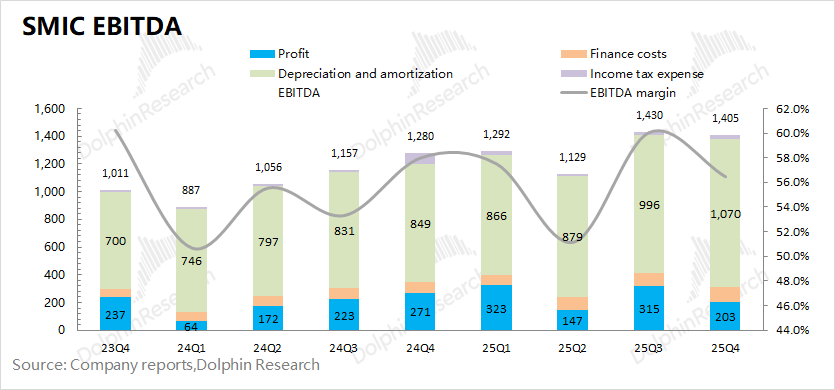
3.3 EBITDA Metrics
From the EBITDA (Earnings Before Interest, Taxes, Depreciation, and Amortization) perspective, SMIC reported US$1.4 billion in EBITDA this quarter, experiencing a slight decline.
A closer look at the metrics reveals that SMIC's EBITDA primarily stems from operating profit release and depreciation & amortization. The calculated profit margin (EBITDA) decreased to 56.5% this quarter, largely due to the impact of a lower gross profit margin.
End of Content
- END -
// Reprint Authorization
This article is an original work by Dolphin Research. Reprinting requires explicit authorization.
// Disclaimer and General Disclosure
This report is intended for general comprehensive data purposes, designed for general reading and data reference by users of Dolphin Research and its affiliated entities. It does not take into account the specific investment objectives, investment product preferences, risk tolerance, financial status, or particular needs of any individual receiving this report. Investors are advised to consult with independent professional advisors before making investment decisions based on this report. Any person making investment decisions using or referring to the content or information in this report assumes all associated risks. Dolphin Research shall not be held liable for any direct or indirect responsibilities or losses arising from the use of the data contained in this report. The information and data in this report are sourced from publicly available information and are for reference purposes only. Dolphin Research strives to ensure, but does not guarantee, the reliability, accuracy, and completeness of the information and data.
The information or viewpoints mentioned in this report shall not, under any jurisdiction, be construed or deemed as an offer to sell securities or an invitation to buy or sell securities, nor shall they constitute recommendations, inquiries, or endorsements of relevant securities or related financial instruments. The information, tools, and data contained in this report are not intended for or designed for distribution to, or use by, any person in any jurisdiction where such distribution, publication, provision, or use would contradict applicable laws or regulations or result in Dolphin Research and/or its subsidiaries or affiliated companies being subject to any registration or licensing requirements in that jurisdiction.
This report solely reflects the personal viewpoints, insights, and analytical methods of the relevant contributors and does not represent the stance of Dolphin Research and/or its affiliated entities.
This report is produced by Dolphin Research, with copyright solely owned by Dolphin Research. Without prior written consent from Dolphin Research, no institution or individual may (i) produce, copy, duplicate, reproduce, forward, or create any form of copies or reproductions in any manner, and/or (ii) directly or indirectly redistribute or transfer to any other unauthorized persons. Dolphin Research reserves all relevant rights.
-
![]()
Li Bin Claims, 'Denying the Pure EV Trend is Like Ostrichism.' What's Li Xiang's Take?
-
Lenovo: Liu Jun Turns Left, Yang Yuanqing Turns Right
-
Lenovo: Liu Jun Goes Left, Yang Yuanqing Goes Right
-
![]()
MiniMax Shares Unlock: Cornerstone Shareholders Show Long-Term Optimism, Yet Stock Plummets Nearly 30% in Two Days; Zhipu Also Sees Nearly 20% Drop Today
-
![]()
Single-Day Plunge of 40%: The 'First AGI Stock' Faces More Than Just Share Price Concerns
-
![]()
Ricoh and Fuji Hike Prices on Legacy Edge; Insta360 Poised to Disrupt Mirrorless Camera Market
-
![]()
Ricoh and Fujifilm Raise Prices in Tandem, Relying on Established Reputations; Insta360 Poised to Disrupt Mirrorless Camera Market
-
![]()
Strategic Shift in Photoelectric Sensing: Maxvision Secures Controlling Stake in CAS Optotech