Over 4,000 Exhibitors and Six Attraction Strategies Across 31 Provinces: The CIIE Investment Opportunity List
 11/10 2026
 381
In the first three quarters of 2026, China's goods trade imports and exports totaled 39.94 trillion yuan, up 18.8% year on year—the fastest growth for the same period in nearly five years. Exports reached 23.2 trillion yuan, up 16.4%, while imports totaled 16.74 trillion yuan, up 22.3%. Import growth outpaced export growth by 5.9 percentage points and has held above 20% for seven consecutive months since March.
The current import expansion period is precisely the window in which importing entities, settlement functions, and supply chain services are easiest to land. This year's CIIE happens to fall within this window: 162 countries, regions, and international organizations participated; 4,142 overseas enterprises exhibited; and for the first time, more than 300 Fortune Global 500 and industry-leading enterprises took part. Representative exhibits for "global debuts, Asian premieres, and China premieres" exceeded 480—all hitting record highs.
The exhibitor list is long, but local areas have very little time. Who is worth talking to, what to discuss, and how to discuss it tests not the information gap but the efficiency of research and judgment. Drawing on the Huoshi Xinglan industrial AI agent, we analyzed the import landscape of 31 provinces in the first three quarters and the attraction opportunities at the CIIE.
Provincial landscape: the stock is highly concentrated in coastal areas, and the increment is further gathering toward the leaders
First, the stock. In the first three quarters, imports were highly concentrated in four coastal provinces and municipalities: Guangdong with 3,610.75 billion yuan, accounting for 21.57% of the national total; Beijing with 2,263.95 billion yuan, accounting for 13.52%; Shanghai with 2,134.64 billion yuan, accounting for 12.75%; and Jiangsu with 2,022.46 billion yuan, accounting for 12.08%. Together they accounted for 59.92%, and the top ten provinces together accounted for 82.77%.
By regional block, the 10 eastern provinces and municipalities accounted for 80.73%, the 12 western provinces, autonomous regions, and municipalities accounted for 8.84%, the 6 central provinces accounted for 7.47%, and the 3 northeastern provinces accounted for 2.96%. The 11 coastal provinces and municipalities together accounted for 70.52%, and the 9 border provinces and autonomous regions together accounted for 6.98%. Jilin, Xinjiang, Shanxi, Gansu, Guizhou, Ningxia, Tibet, and Qinghai—8 provinces and autonomous regions—together accounted for only 243.23 billion yuan, or 1.45%.
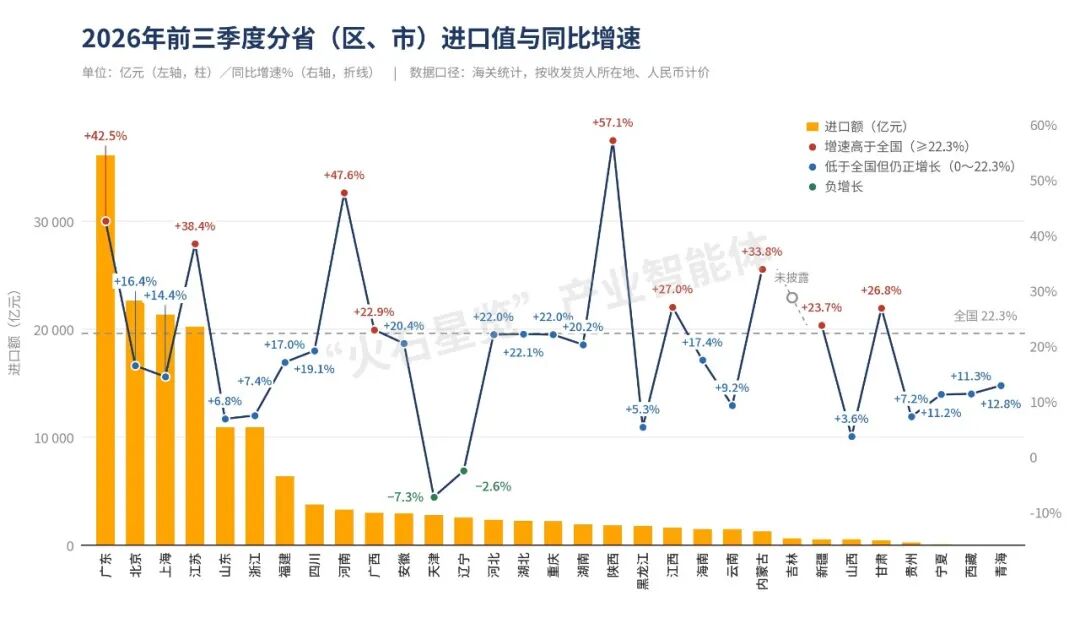 Figure: Import values and year-on-year growth rates of each province in the first three quarters of 2026 (click to enlarge). Source: Huoshi Xinglan industrial AI agent
Adding growth rates on top, the landscape shifts: of the national import increment of 3,052.71 billion yuan, Guangdong contributed 35.28%, Jiangsu 18.38%, Beijing 10.45%, and Shanghai 8.80%. The four provinces and municipalities together accounted for 72.91%, with their corresponding share rising from 57.02% to 59.92%—concentration at the top was further strengthened. The combined share of the second tier, Shandong (up 6.8%) and Zhejiang (up 7.4%), fell from 14.90% in the same period last year to 13.05%. Among the third tier, Fujian performed most prominently, contributing 3.03% of the increment with a 3.81% share, making it one of the most efficient markets.
Category attribution: mechanical and electrical products and high-tech are the main engines of this round of import expansion
Behind the divergence in the provincial landscape is a profound change in the structure of import categories. At the national level, in the first three quarters, mechanical and electrical products accounted for 43.18% of imports and grew 33.3% year on year; high-tech products accounted for 36.48% and grew 42.2%; agricultural products accounted for 7.05% and grew 5.8%. Among them, integrated circuit imports grew 56.6%, and storage component imports grew 1.5 times. By province:
Most high-growth provinces are tied to the dual wheel of the "electronics cycle + energy bulk commodities." The core drivers for Guangdong and Jiangsu are integrated circuits/semiconductors and their equipment and materials, storage, and electronic components, superimposed on AI computing power, storage price increases, and the recovery of the global electronics cycle. The foreign trade of the two provinces is dominated by mechanical and electrical products and high-tech products, and imports transmit quickly to exports and output value with the greatest elasticity. Shaanxi is driven both by Xi'an's storage/electronic materials and by energy and chemical raw materials such as crude oil, natural gas, and metal ores; the resonance of energy prices and electronics pushed up the readings. Henan is driven by mobile phones and electronic components (the intelligent terminal manufacturing chain), superimposed on the recovery of bulk commodities such as grain and metal ores. Inner Mongolia, Gansu, and Xinjiang more reflect upstream resources such as coal, oil and gas, minerals, and metals, and corridor economies; growth is high, but unit prices and cyclical attributes are strong.
The medium-speed steady-growth economies are port and consumption-oriented economies. Beijing is affected by oil and gas prices and the rhythm of agricultural products and automobiles, leaning more toward "input-type security." Shanghai is driven by the recovery of chips and high-end equipment, but its port base is large. Hainan is related to policy items such as duty-free consumer goods in the free trade port, "zero tariffs" on raw and auxiliary materials, and aircraft and ships, with a structure leaning toward consumption and assets.
Below average are provinces dependent on bulk commodities and export-oriented manufacturing with pressured profits. In the imports of Zhejiang and Shandong, petrochemical raw materials, metal ores, and grain account for no small share; falling bulk commodity prices or stable demand will lower nominal growth. Although Zhejiang is a major foreign trade province, its import structure is strongly complementary to exports and its processing depth is relatively lower than that of Guangdong and Jiangsu, so its elasticity is flatter. Shanxi and Guizhou are small in volume and lean toward energy, minerals, and raw materials, with limited elasticity.
From categories to exhibition booths: matching the six major CIIE sections with provincial demand
Category attribution answers "which chain the opportunity is on," while the CIIE answers "where the chain leaders and key-link enterprises are." By overlaying the verifiable facts of the two major exhibition area sections with the import category signals of each province, we can see the mapping between exhibitor resources and local demand:
Table: Matching of the CIIE with resources of each province
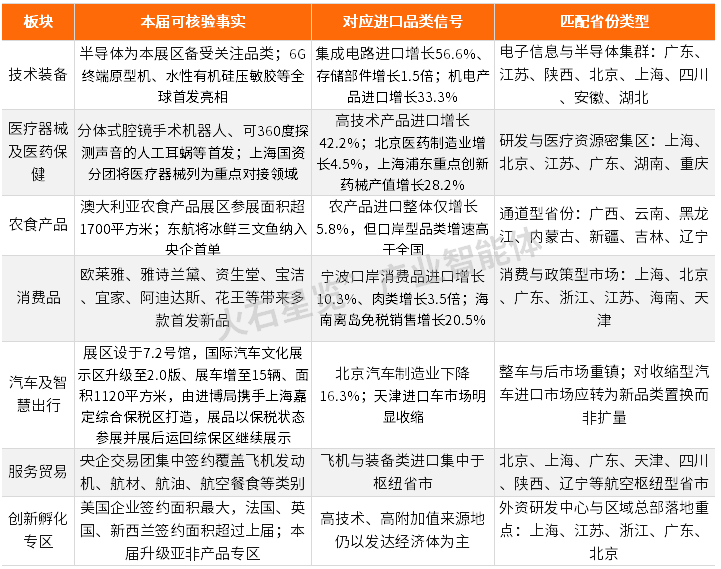 Source: Huoshi Xinglan industrial AI agent
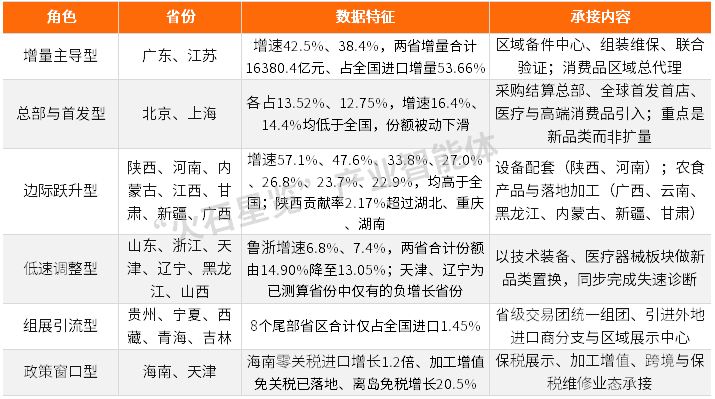
The value of the CIIE to local areas ultimately comes down to one question: can purchasing relationships be transformed into permanent entities. Combining scale, growth rate, increment contribution rate, and category attribution, the 31 provinces can be grouped into six different approaches:
Table: Six types of role approaches
Source: Huoshi Xinglan industrial AI agent
-
![]()
Anthropic Gives AI Models an 'ID Card' That Even They Can't Forge
-
![]()
OFILM Reinvests in Zhongke Daojing to Drive TGV Technology into Semiconductor Packaging
-
![]()
At Least Eight Orders in a Single Year: Why Does This Optical Company Keep Receiving Repeat Orders?
-
![]()
Pupil Dilation Isn't About "Magnifying the Image"—It's About "Replicating the Exit Pupil": The Underlying Logic of Optical Waveguide Eyebox
-
![]()
When World Models Are No Longer a Selling Point, Is the Intelligent Driving Industry Entering the Era of Technology Delivery?
-
![]()
Beyond Smart Glasses, Meta Charts a New Course!
-
![]()
Over 4,000 Exhibitors and Six Attraction Strategies Across 31 Provinces: The CIIE Investment Opportunity List
-
[Insight] 2026 Global and China LDI Inner-Layer Photosensitive Circuit Ink Market Status and Major Enterprise Analysis